
Fig. 4
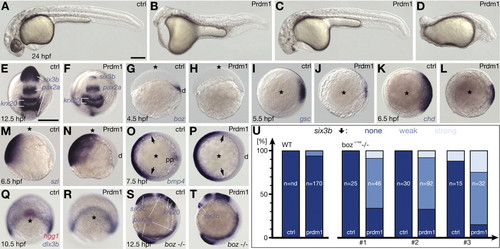
prdm1 misexpression phenotype. (A-D) Lateral view, anterior to the left. (E,F) Dorsal view, anterior to the top. (G,H,M,N,S,T) Lateral view, dorsal to the right. (I-L,O,P) Animal view, dorsal to the right. (Q,R) Animal view, dorsal to the bottom. (S,T) Dorsal view, animal to the top. (A,E,G,I,K,M,O,Q,S) Untreated controls (ctrl). (B-D,F,H,J,L,N,P,R,T) Embryos microinjected with synthetic prdm1 RNA (Prdm1). (A-D) Overall morphology at 1 dpf. (E,F) six3b, pax2a, krox20 expression in the developing brain at early somitogenesis; somitic dlc expression for staging purposes. (G,H) boz; (I,J) gsc; (K,L) chd; (M,N) szl; and (O,P) bmp4 expression. (Q,R) hgg1 and dlx3b expression at the start of somitogenesis. (S) six3b, pax2a, krox20 expression in untreated and (T) prdm1-injected boz embryos with low phenotypic penetrance and expressivity. (U) prdm1-misexpression causes increased penetrance and expressivity of the boz phenotype monitored by reduction of six3b expression; independent females (#1-3). For details see text. Scale bars: 200 µm. d, dorsal; pp, prechordal plate. Animal pole highlighted by a star.
|
| Genes: | |
|---|---|
| Fish: | |
| Anatomical Terms: | |
| Stage Range: | 50%-epiboly to 5-9 somites |