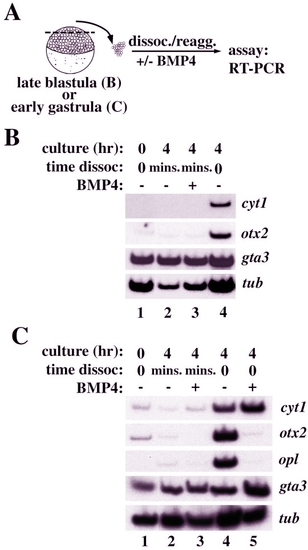
Bone morphogenetic protein-4 (BMP4) does not restore cyt1 expression, and autoneuralization is not induced in dissociated zebrafish animal caps. A: Schematic representation of experiment analyzing the effect of dissociation and BMP4 treatment on gene expression in zebrafish blastula stage animal caps. Animal caps were dissected from late blastula (4 hpf, sphere stage; as shown) or early gastrula (6 hpf, shield stage; not shown), aggregated into groups of 10 and either cultured intact, or after dissociation and reassociation (see Experimental Procedures section). Explants were then cultured for 4 hr (until 8 hpf, equivalent to midgastrula)in the presence or absence of 50ng/ml BMP4 followed by analysis by reverse transcriptase-polymerase chain reaction (RTPCR)for expression ofcyt1, otx2, opl, gta3, andtubulin. B: Results of experiments on blastula stage caps. Animal caps were harvested immediately after dissection (lane 1) or after 4 hr in culture (lanes 2–4). Explants cultured for 4 hr were either dissociated into single cells and immediately reassociated (lanes 2 and 3, mins.)or left intact (lane 4). Explants were cultured in the presence (lane 3) or absence (lanes 2 and 4)of 50 ng/ml of BMP4. C: Results of experiments on gastrula stage caps. Animal caps were harvested immediately after dissection (lane 1) or after 4 hr in culture (lanes 2–5). Explants cultured for 4 hr were either dissociated into single cells and immediately reassociated (lanes 2 and3, mins.) or left intact (lanes 4 and 5). Explants were cultured in the presence (lane 3 and 5) or absence (lanes 2 and 4) of 50 ng/ml of BMP4.cyt1 is expressed in the zebrafish enveloping layer, otx2, and opl dorsally and gta3 ventrally in the zebrafish. tub was used as a loading control.
|
