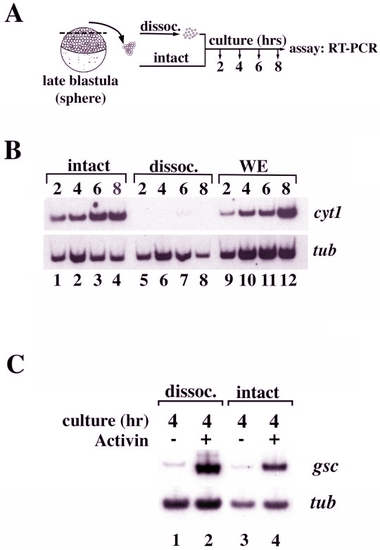
Dissociation of zebrafish animal caps disrupts cyt1 expression. A: Schematic overview of experimental design. Animal caps were dissected at late blastula stages (sphere stage, 4 hpf), aggregated in groups of 10 and used intact or dissociated into individual cells (see Experimental Procedures section), followed by culture for various periods of time. After the culture period, explants and cells were harvested and assayed for cyt1 expression by reverse transcriptase-polymerase chain reaction (RTPCR; see Experimental Procedures section). B: Blastula stage intact caps (lanes 1–4), dissociated caps (lanes 5–8), and whole embryos (lanes 9–12) were cultured for 2 hr (until 6 hours postfertilization [hpf], equivalent to early gastrula), 4 hr (until 8 hpf, equivalent to mid-gastrula), 6 hr (until 10 hpf, equivalent to end of gastrulation), or 8 hr (until 12 hpf, equivalent to onset of somitogenesis) before harvesting and analysis for cyt1 expression by RT-PCR. tub expression was used as a loading control. C: Blastula stage dissociated caps (lanes 1 and 2) and intact caps (lanes 3 and 4) were cultured for 4 hr (until 8 hpf, equivalent to mid-gastrula) in the absence (lanes 1 and 3) or presence (lanes 2 and 4) of 1 μ/ml human activin A and assayed for gsc expression by RT-PCR. tub expression was used as a loading control.
|
