FIGURE SUMMARY
Title

Epithelial transcription factor Elf3 mediates host immune responses to microbiota and protects against aerocystitis in zebrafish

Authors
Davis, B.R., Lickwar, C.R., Löhr, C.V., Wen, J., Morash, M., Sweeney, M.I., Reich, E.L., Moore, P.J., Tobin, D.M., Rawls, J.F.
Source
Full text @ MBio

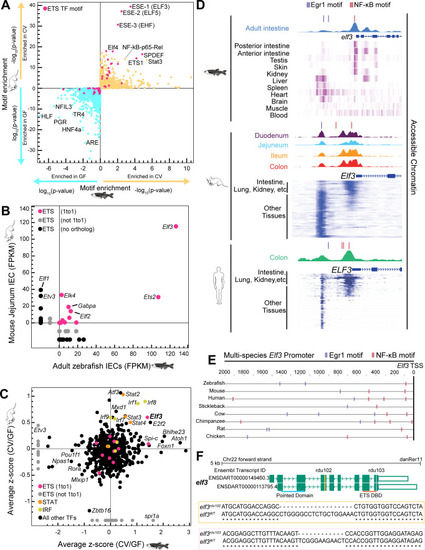
Identification of a candidate TF mediating conserved host responses to the microbiota. (A) TFBM enrichment as assessed by default Hypergeometric Optimization of Motif EnRichment (HOMER) software (47) near genes microbially responsive in mouse (y-axis) and zebrafish (x-axis) digestive tissue. The log10(P-value) (GF/CV) and −log10(P-value) (CV/GF) are plotted for motif enrichment. Both comparisons are plotted on each axis for mouse (y-axis) and zebrafish (x-axis) and are differentiated by the blue and yellow arrows. (B) mRNA expression of ETS transcription factors in mouse and zebrafish IECs represented as fragments per kilobase of transcript per million (FPKM) mapped reads. The orthologous relationships between each ETS TF in zebrafish and mice are indicated by the pink (one to one), gray (not one to one), and black (no ortholog) colored data points. (C) Average z-scored mRNA levels of genes significantly differential in CV/GF comparisons across multiple mouse and zebrafish studies. (D) Visualization of accessible chromatin peaks within the elf3 promoter of zebrafish (45), mouse (46), and human (45) IECs. Below the accessible chromatin peaks for each species are heatmaps of ATAC-seq performed in diverse zebrafish (51), mouse (52), and human (52) tissue types (visualized via the WashU genome browser [53]). For the mouse and human data sets, more epithelial tissues like the intestine and lung are grouped compared to other tissue types. (E) Comparison of the elf3 promoter across diverse vertebrate species with the location of the conserved Erg1 and NF-κB motifs depicted by the blue and pink boxes, respectively. The vertebrates featured in this analysis include zebrafish (Danio rerio), mouse (Mus musculus), human (Homo sapiens), stickleback (Gasterosteus aculeatus), cow (Bos taurus), chimpanzee (Pan troglodytes), rat (Rattus norvegicus), and chicken (Gallus gallus). (F) Schematic of the protein coding elf3 isoforms in zebrafish derived from the UCSC genome browser (GRCz11/danRer11). Exons are colored green, and introns are depicted as green arrows. The yellow and pink vertical lines indicate the location of the rdu102 and rdu103 CRISPR lesions, respectively. The horizontal lines at the bottom of the schematic indicate the location of the SMART-predicted functional domains (54, 55), Pointed (blue) and ETS DNA-binding (orange).

elf3 genotype and microbial status have significant effects on the larval zebrafish transcriptome. (A) Schematic depicting the experimental conditions of the bulk RNA-seq experiment where clutches of elf3+/+ and elf3−/− larvae produced from homozygous incrosses were derived GF. At 3 days post-fertilization (dpf), half of the larvae from each genotype were colonized with a conventional zebrafish microbiota (CV) (indicated with solid or dashed lines), and all groups were maintained until a 6 dpf endpoint, at which point pooled larval samples were prepared for sequencing (n = 6–16 larvae per pool). (B) principal component analysis (PCA) plot of the normalized counts for each replicate of the four experimental conditions (GFWT:3, GFMut:4, CVWT:4, CVMut:5). (C) Venn diagram overlap of the genes significantly differentially expressed (P adjusted < 0.05) in the four comparisons. (D) Metascape (61) analysis of the enriched GO terms, biological processes, and signaling pathways that are upregulated (red lettering) and downregulated (blue lettering) in each of the four RNA-seq comparisons. Abbreviations: NSCM metabolic process, nucleobase-containing small molecule metabolic process; modified amino acid MP, modified amino acid metabolic process; metabolism of AAs & derivatives, metabolism of amino acids and derivatives. (E) Scatterplot of the gene log2 fold change for all significant differentially expressed genes in the CVWT/GFWT and CVMut/GFMut RNA-seq comparisons (P adjusted < 0.05), which assess the effect of microbial status on gene expression. (F) Scatterplot of the gene log2 fold change for all significant differentially expressed genes in the GFMut/GFWT and CVMut/CVWT RNA-seq comparisons (P adjusted < 0.05), which assess the effect of elf3 genotype on gene expression.

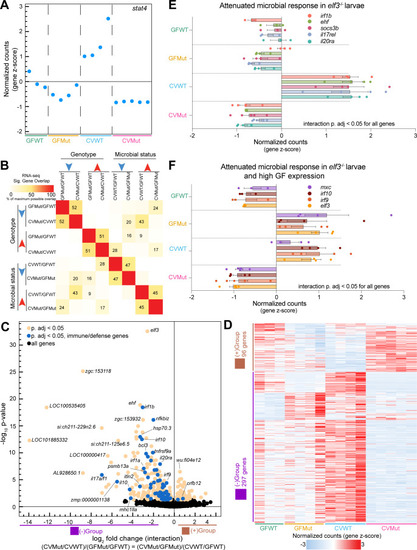
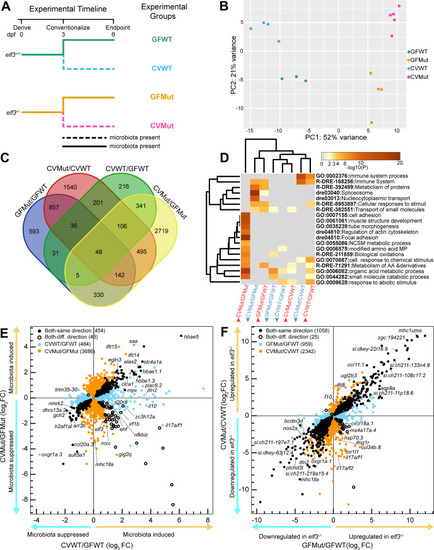
Identification of interaction genes that integrate elf3 genotype and microbial status. (A) Plot of the z-scored normalized counts for significant interaction gene stat4 where each dot represents one replicate for the indicated experimental condition (P adjusted < 0.05). (B) Pairwise comparisons of maximum possible overlap between the significant up- or downregulated genes for each of the four RNA-seq comparisons. (C) Volcano plot depicting the log2 fold change (FC) (x-axis) vs −log10P-value (y-axis) for significant interaction genes identified via likelihood ratio test analysis (P adjusted < 0.05). (D) Heatmap of the z-scored normalized counts for all significant interaction genes. Out of a total of 393 genes, 96 genes have a positive log2FC and 297 genes have a negative log2FC (P adjusted < 0.05). (E) Bar plot of the z-scored normalized counts for genes representative of the attenuated microbial response in elf3 mutant larvae. All depicted genes are significant interaction genes (P adjusted < 0.05). (F) Bar plot of the z-scored normalized counts for example immune response genes that fail to be microbially induced in elf3 mutant larvae at a magnitude comparable to wild-type and that additionally exhibit high expression in GF conditions. All depicted genes are significant interaction genes (P adjusted < 0.05).

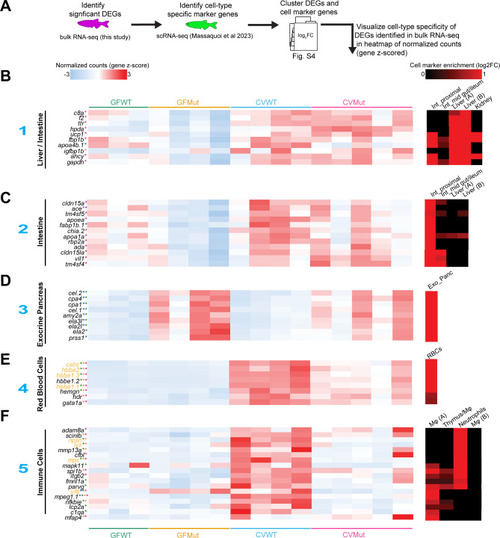
Differentially expressed genes in larval RNA-seq exhibit cell-type specificity. (
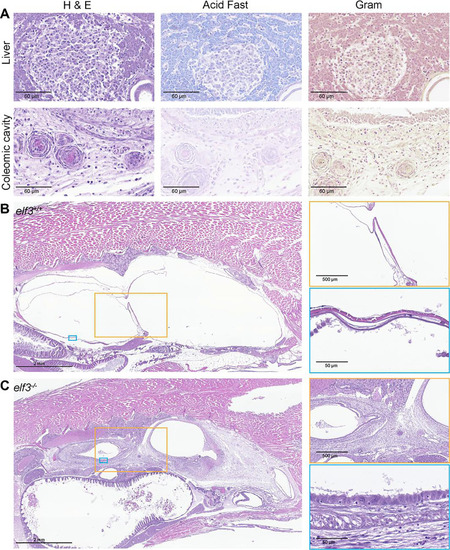
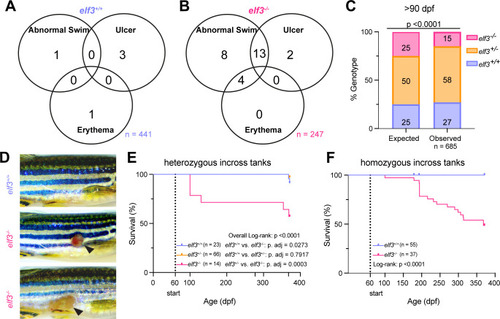
A) Schematic of application of cell type-specific calls to significant differentially expressed genes (DEGs) in the RNA-seq data set. Significant DEGs were identified and clustered with cell marker genes identified in an scRNA-seq data set generated from the disassociated cells of 6 dpf zebrafish (27). The resulting clustered heatmap is featured in Fig. S4, and the heatmaps below are visualizations of example genes for each cell type. (B) Heatmaps of the gene z-scored normalized counts for diverse cell markers such as the liver/intestine (B), intestine (C), exocrine pancreas (D), red blood cells (RBCs) (E), and immune cells (F). All genes are significant in at least one of the four RNA-seq comparisons (P adjusted < 0.05). The color of the asterisk next to each gene indicates in which comparison(s) the gene is significantly differential (CVMut/GFMut: maroon, CVWT/GFWT: orange, GFMut/GFWT: blue, and CVMut/CVWT: green). Genes in yellow font are significant interaction genes. The blue numbers to the left of each heatmap indicate the cell type cluster the example marker genes represent (Fig. S4). The heatmaps on the far right show the log2 fold change of the indicated gene as a function of cell marker enrichment (27). Abbreviations: int_proximal, intestine_small/proximal; int_mid gut/ileum, intestine mid gut/ileum; exo_panc, exocrine pancreas; Mφ, macrophages.

elf3−/− adults present immune-related pathologies and exhibit poor survival. (A, B) Venn diagram of observed clinical signs of health deterioration, such as abnormal swimming, erythema, and ulcer development in elf3+/+ (A) and elf3−/− (B) adults. (C) Comparison of the genotypic ratios observed in adult zebrafish >90 dpf generated from heterozygous incrosses of elf3+/− parents to expected Mendelian outcomes. (D) Representative images of severe (bottom) and milder (middle) ulcers in elf3−/− adults compared to healthy elf3+/+ adults (top). (E) Kaplan-Meier survival curves of co-housed elf3 genotypes starting from the initial observation at 60 dpf (dotted line) and ending at 371 dpf. Repeated genotyping events occurred at 60 dpf, 100 dpf, 277 dpf, and 368 dpf. (F) Kaplan-Meier survival curves of separately housed elf3+/+ and elf3−/− adults starting from the initial observation at 60 dpf (dotted line) and ending at 371 dpf. P-values were calculated for panel A using a chi-square goodness-of-fit test and for panels E and F using an overall log-rank test followed by Bonferroni-corrected log-rank tests for individual comparisons when required.

Moribund elf3−/− adults develop aerocystitis. (A) Representative images of granulomas that can develop in moribund elf3−/− adults in the liver and coelomic cavity. For each example granuloma, there is a hematoxylin and eosin (H&E)-stained image, an acid-fast-stained image, and a Gram-stained image to assess the overall morphology of the granuloma as well as to test for the presence of Mycobacterium. (B, C) Representative images of the coelomic cavity of healthy appearing, wild-type controls (B) and moribund mutant (C) adults (histopathological evaluation of 12 moribund mutants and 12 wild-type controls). The two inset images featured below are magnified images of the swim bladder that highlight the inflammation observed in the anterior and posterior chambers of the moribund elf3 mutant. Scanned images were rotated or vertically reflected for consistent body orientation across all images.

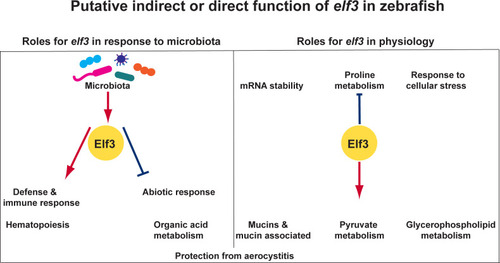
Summary model indicating putative roles for elf3 in zebrafish. elf3 has roles in mediating host transcriptional responses to the microbiota as well as transcriptional programs important for microbe-independent physiologic functions. In response to microbes, elf3 mediates the upregulation of genes involved in immune and defense response as well as hematopoietic marker genes while mediating the downregulation of genes with roles in abiotic responses (e.g., circadian rhythm) and organic acid metabolism. Additionally, elf3 mutation results in the upregulation of transcriptional programs like mRNA stability, proline metabolism, and response to stress and the downregulation of pyruvate and glycerophospholipid metabolism genes in a microbe-independent manner. elf3 mutation has significant consequences for the survival of adult zebrafish; however, it remains unclear if this effect is related to the role of elf3 in host-microbiota interactions. All the putative roles for elf3 indicated in this model could be direct or indirect.

Acknowledgments
This image is the copyrighted work of the attributed author or publisher, and ZFIN has permission only to display this image to its users. Additional permissions should be obtained from the applicable author or publisher of the image. Full text @ MBio