FIGURE SUMMARY
Title

Oxidative phosphorylation is required for cardiomyocyte re-differentiation and long-term fish heart regeneration

Authors
Lekkos, K., Hu, Z., Nguyen, P.D., Honkoop, H., Sengul, E., Alonaizan, R., Koth, J., Ying, J., Lemieux, M.E., Kenward, A., Keeley, S., Spanjaard, B., Kennedy, B.W.C., Sun, X., Banecki, K., Potts, H.G., Ruggiero, G., Montgomery, J., Panáková, D., Junker, J.P., Heather, L.C., Wang, X., Gonzalez-Rosa, J.M., Bakkers, J., Mommersteeg, M.T.M.
Source
Full text @ Nat Cardiovasc Res

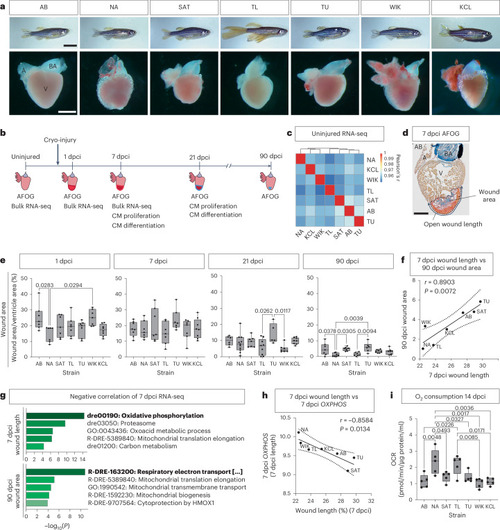
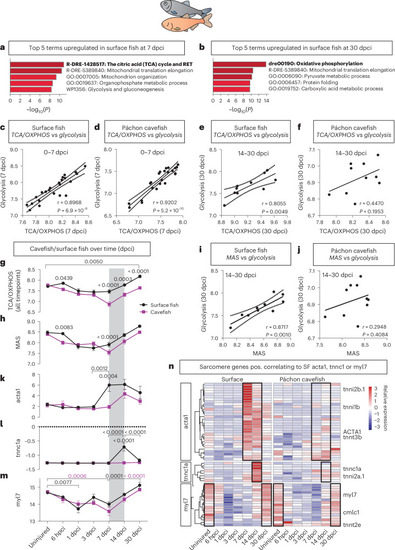
Differential regenerative response to cryo-injury among wild-type adult zebrafish strains identifies OXPHOS as beneficial for regeneration.

a, Representative images of adult wild-type zebrafish strains (scale bar, 1 cm) and their intact heart, including atrium (A), bulbus arteriosus (BA) and ventricle (V) (scale bar, 500 μm). b, Experimental procedure to harvest and assay zebrafish hearts prior to and after cryo-injury. c, Correlation matrix of bulk RNA-seq data on uninjured ventricles showing a strong correlation between strains. d, Representative AFOG image of an AB heart at 7 dpci indicating wound area and open wound length measurements (scale bar, 300 µm). e, Wound area quantification of the seven wild-type strains showed significant differences at 1, 21 and 90 dpci among the strains. f, Positive correlation between 7 dpci wound length and 90 dpci wound area. g, The top five enriched processes in the genes negatively correlating to wound length at 7 dpci and area at 90 dpci in the 7 dpci bulk RNA-seq. h, Significant negative correlation between 7 dpci wound length and OXPHOS. i, OCR measurements of 14 dpci ventricles show significant differences in OXPHOS among the seven wild-type zebrafish strains. c, n = 3 biological replicates per zebrafish strain; e, 1 dpci: AB, NA, SAT, TL, TU, WIK n = 7; KCL n = 8. 7 dpci: NA, SAT, TL, TU, WIK n = 7; AB, KCL n = 8. 21 dpci: SAT, WIK n = 7; AB n = 6; NA n = 11; TL n = 9; TU n = 5; KCL n = 8. 90 dpci: AB, NA, SAT, TL, WIK n = 7; TU n = 6; KCL n = 8 (biological replicates). i, n = 5 biological replicates per strain. e,i, One-way ANOVA with Tukey’s test. fh, Simple linear regression. g, Analysis performed using Metascape. CM, cardiomyocyte.

Source data

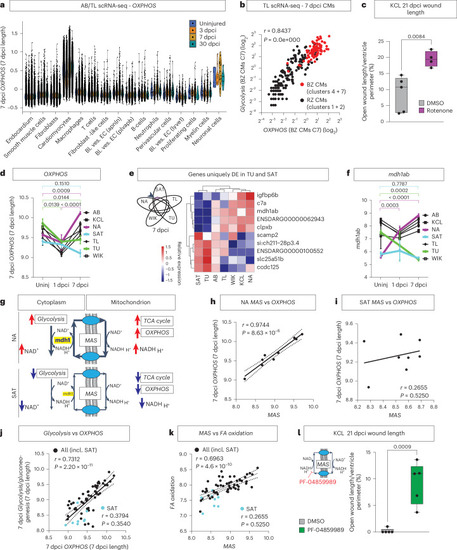
Upregulation of the MAS drives OXPHOS and regeneration.

a, OXPHOS gene expression is highest in cardiomyocytes compared to other cell types in scRNA-seq of AB/TL—reanalysis of Hu et al.27. b, Positive correlation between Glycolysis and OXPHOS in 7 dpci cardiomyocytes, with highest levels of both in the border zone cardiomyocytes (red), by reanalyzing scRNA-seq data of TL published previously by Honkoop et al.13. Clusters 1, 2, 4 and 7 refer to the clustering in the original publication. c, Increased wound length in KCL treated with rotenone in comparison to DMSO control at 21 dpci. d, Temporal pattern of OXPHOS gene expression in the bulk RNA-seq data. e, Venn diagram indicating uniquely differentially expressed (DE) genes in TU and SAT (AB and KCL not shown but included in analysis) with heatmap of the top DE genes in the bulk RNA-seq identifying mdh1ab uniquely downregulated in TU and SAT versus the other strains. f, Expression pattern of mdh1ab over time in the bulk RNA-seq data of the strains. g, Schematic diagram indicating the influence of activated MAS on maintaining cytosolic and mitochondrial balance of NAD+/NADH in NA versus SAT. h,i, Positive correlation between the MAS and OXPHOS in the NA strain (h) but not the SAT strain (i). j,k, Positive correlation of Glycolysis with OXPHOS (j) and MAS versus Fatty Acid (FA) oxidation (k) in all strains but absence of correlation in SAT. l, Wound length quantification showing increased 21 dpci wound length in KCL hearts treated with MAS inhibitor PF-04859989 in comparison to DMSO control. c, Rotenone n = 4, DMSO n = 5 (biological replicates); d,f, uninjured: n = 3 per strain, 1 dpci: SAT, TU n = 2, AB, NA, TL, WIK, KCL n = 3, 7 dpci n = 3 per strain (biological replicates); e, n = 3 biological replicates per strain; l, n = 5 biological replicates per group. b,hk, Simple linear regression. c,l, Unpaired two-tailed Student’s t-test. d,f, Two-way ANOVA with Tukey’s test; data presented as mean ± s.e.m. Bl. ves. EC, blood vessel endothelial cell; BZ, border zone; C, cluster; CM, cardiomyocyte; incl., including; RZ, remote zone; Uninj, uninjured.

Source data

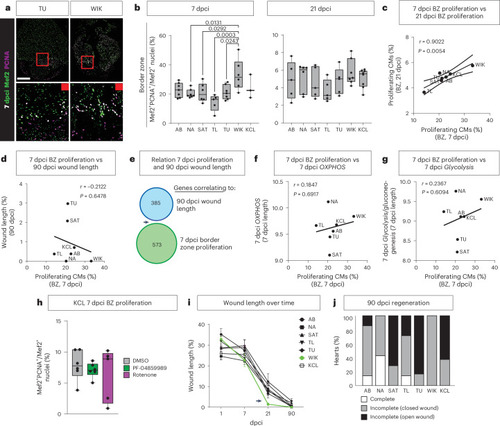
OXPHOS is not required for cardiomyocyte proliferation.

a, Representative images of immunofluorescence staining showing Mef2+PCNA+ double-positive proliferating cardiomyocytes in TU and WIK at 7 dpci. Framed areas highlight the wound border zone (red) (scale bar, 300 μm). b, Quantification of Mef2+PCNA+ double-positive cells showing differences in proliferating cardiomyocytes in the border zone at 7 dpci but not at 21 dpci. c, Positive correlation of percentage of proliferating cardiomyocytes in the border zone between 7 dpci and 21 dpci. d, No correlation between 7 dpci border zone proliferation and 90 dpci wound length. e, Venn diagram displaying complete lack of overlap between genes correlating to 7 dpci border zone proliferation and 90-dpci wound length. f,g, No correlation between border zone proliferation and OXPHOS (f) or Glycolysis (g) at 7 dpci. h, Quantification of Mef2+PCNA+ cells showing no difference in proliferating cardiomyocytes in the border zone of 7 dpci KCL adult treated with inhibitor PF-04859989 or rotenone compared to DMSO control. i, Temporal wound length reduction of all strains between 1, 7, 21 and 90 dpci. Arrow highlighting the strong decrease in wound length in WIK between 7 dcpi and 21 dpci. j, Percentage of hearts completely regenerated at 90 dpci or with closed compact wall but remaining internal scar or with open compact wall and internal scar remaining. b, 7 dpci: AB, NA, TU n = 7; SAT, WIK n = 6; TL n = 5; KCL n = 3, 21 dpci: AB, SAT, TL, TU n = 5; NA n = 6; WIK n = 7; KCL n = 8 (biological replicates); h, PF-04859989, DMSO n = 6, rotenone n = 5 (biological replicates); i, AB: 1, 90 dpci n = 7; 7 dpci n = 8; 21 dpci n = 6. NA: 1, 7, 90 dpci n = 7; 21 dpci n = 11. SAT: 1, 7, 21, 90 dpci n = 7. TL: 1, 7, 90 dpci n = 7; 21 dpci n = 9. TU: 1, 7 dpci n = 7; 21 dpci n = 5; 90 dpci n = 6. WIK: 1, 7, 21, 90 dpci n = 7. KCL: 1, 7, 21, 90 dpci n = 8 (biological replicates); j, AB, NA, SAT, TL, WIK n = 7; TU n = 6; KCL n = 8. b,h, One-way ANOVA with Tukey’s test. c,d,f,g, Simple linear regression. h, Two-way ANOVA with Tukey’s test. i, Data presented as mean ± s.e.m. Mef2, myocyte enhancer factor 2; PCNA, proliferating cell nuclear antigen.

Source data

Levels of OXPHOS correlate to the upregulation of embryonic myosin.

a, Representative images of MF20 and embcmhc double immunofluorescence staining showing differential embryonic myosin staining in the border zone cardiomyocytes of NA, WIK, TU and SAT at 7 dcpi and 21 dpci (scale bar, 300 µm). b, Quantification of differential expression of embcmhc in the border zone of the strains at 7 dpci and 21 dpci. c,d, Negative correlation between 7 dpci border zone embcmhc staining with 7 dpci wound length (c) and 21 dpci border zone embcmhc staining with 90 dpci wound area (d). e, Top five positively correlating terms in genes of 7 dpci bulk RNA-seq with 7 dcpi and 21 dpci border zone embcmhc activity. f, Positive correlation of embcmhc staining to MAS at 7 dpci. g, Reduced border zone embcmhc expression in 7 dpci KCL hearts treated with inhibitors PF-04859989 or rotenone compared to DMSO control. Representative images are on the left, and quantification is on the right (scale bar, 300 µm). h, No correlation between embcmhc activity and border zone cardiomyocyte proliferation at 7 dpci. i, Venn diagram displaying high overlap between genes correlating to 90 dpci wound length and 7 dpci embcmhc level but little overlap between embcmhc and border zone proliferation at 7 dpci. j, Levels of OXPHOS in adult 7 dpci remote and border zone cardiomyocytes and 2 dpf embryonic ventricular cardiomyocytes, showing similar levels of OXPHOS in border zone and embryonic cardiomyocytes. Reanalysis of previously published integrated scRNA-seq dataset13. b, 7 dpci: AB n = 8; NA, SAT, WIK n = 7; TL, TU, KCL n = 6, 21 dpci: AB, SAT, WIK n = 6; NA, KCL n = 8; TL n = 9; TU n = 5 (biological replicates); g, DMSO, PF-04859989 n = 6, rotenone n = 4 (biological replicates). b,g, One-way ANOVA with Tukey’s test. c,d,f,h, Simple linear regression. e, Analysis performed using Metascape. BZ, border zone; c, cluster; Embr. V. CM, embryonic ventricular cardiomyocyte; MF20, all cardiomyocytes; RZ, remote zone.

Source data

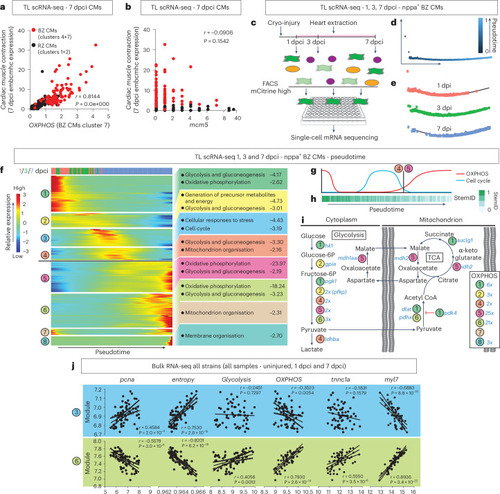
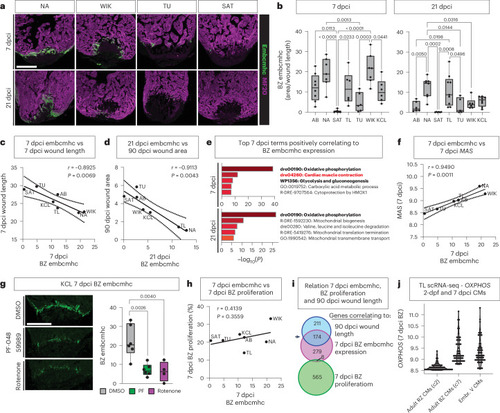
Cardiomyocyte proliferation is separated in time from OXPHOS and cardiomyocyte re-differentiation.

a,b, Positive correlation of cardiac muscle contraction genes in cardiomyocytes to OXPHOS (a) but not to proliferation marker mcm5 (b) by reanalyzing previous scRNA-seq data from Honkoop et al.13. Red indicates border zone cardiomyocytes; clusters are as in the original publication. c, Schematic diagram of the scRNA-seq procedure using the transgenic TgBAC(nppa:mCitrine) line to FACS 1 dcpi, 3 dcpi and 7 dpci border zone cardiomyocytes. d, Timeline generated by pseudotime analysis of the 1 dcpi, 3 dcpi and 7 dpci border zone cardiomyocytes. e, Pseudotime analysis recapitulates the real-time order of the samples. f, Differentially expressed genes changing over pseudotime, grouped into eight modules using unsupervised hierarchical clustering. Each module was analyzed for enriched processes. g, Schematic to indicate how levels of OXPHOS and Cell cycle genes alternate. h, StemID analysis shows that the cardiomyocytes differentiate along the pseudotime. i, Sequential activation of Glycolysis, TCA cycle, MAS and OXPHOS genes based on pseudotime analysis. j, Correlation graphs of strain bulk RNA-seq data comparing significantly expressed genes in modules 3 and 6 with proliferation (pcna), differentiation state (entropy), Glycolysis, OXPHOS, tnnc1 (correlates to border zone embcmhc expression) and myl7 (mature cardiomyocyte marker). Data showing positive correlation between proliferation and de-differentiation with module 3 but negative correlation to module 6. OXPHOS and myl7 have the opposite pattern. Embryonic border zone marker tnnc1a only positively correlates to module 6 and, thus, the re-differentiation stage. df,h, n = 4 hearts per timepoint. a,b,j, Simple linear regression. BZ, border zone; CM, cardiomyocyte; RZ, remote zone.

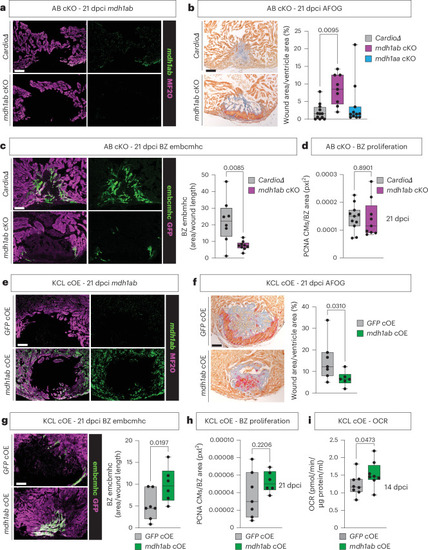
Genetic manipulation of mdh1ab confirms its role during long-term regeneration and cardiomyocyte re-differentiation.

a, Representative images of RNAscope analysis of AB cardiomyocyte-specific mdh1ab knockout and cardiodeleter control showing absence of mdh1ab mRNA in the MF20+ myocardium in the knockout. b, Representative images of AFOG staining on AB cardiomyocyte-specific mdh1ab knockout and cardiodeleter control with wound area quantification showing increased 21 dpci wound area in the mdh1ab knockout but not the mdh1aa knockout in comparison to controls. c, Representative images of embchmc immunohistochemistry on AB cardiomyocyte-specific mdh1ab knockout and cardiodeleter control, with quantification showing reduced presence of embcmhc in the knockout compared to control. d, Quantification of PCNA+ border zone cardiomyocytes indicates no differences in proliferation between the AB cardiomyocyte-specific mdh1ab knockout and the cardiodeleter control. e, Representative images of RNAscope analysis of KCL cardiomyocyte-specific mdh1ab overexpression and GFP control showing increased levels of mdh1ab mRNA in the MF20+ myocardium in the overexpression heart. f, Representative images of AFOG staining on KCL cardiomyocyte-specific mdh1ab overexpression and GFP control, with wound area quantification showing reduced 21 dpci wound area in the mdh1ab overexpression model compared to controls. g, Representative images of embchmc immunohistochemistry on KCL cardiomyocyte-specific mdh1ab overexpression and GFP control, with quantification showing reduced presence of embcmhc in the overexpression hearts compared to control. h, Quantification of PCNA+ border zone cardiomyocytes indicate no differences in proliferation between the KCL cardiomyocyte-specific mdh1ab overexpression and GFP control. i, OCR measurements of 14-dpci ventricles show increased levels of OXPHOS in the overexpression hearts compared to control (scale bars, 100 μm). b, mdh1ab cKO n = 9, mdh1aa cKO n = 11, cardiodeletern = 12 (biological replicares); c, mdh1ab cKO n = 9, cardiodeletern = 8 (biological replicates); d, mdh1ab cKO n = 9, cardiodeletern = 11 (biological replicates); f,h, mdh1ab cOE n = 6, GFP cOE n = 7 (biological replicates); i, n = 8 biological replicates per group. b, One-way ANOVA with Tukey’s test. c,f,i, Unpaired one-tailed Welchʼs t-test. d,h, Unpaired two-tailed Student’s t-test. g,i, Unpaired one-tailed Student’s t-test. BZ, border zone; CM, cardiomyocyte.

Source data

Strongly reduced re-differentiation gene expression in A. mexicanus cavefish versus surface fish.

a,b, Top five enriched processes upregulated in surface fish at 7 dpci (a) and 30 dpci (b) compared to cavefish. cf, Positive correlation of TCA/OXPHOS with Glycolysis genes at all timepoints in surface fish (c and e) but only up to 7 dpci in cavefish (d and f). g,h, Expression over time in bulk RNA-seq data. Although TCA/OXPHOS genes are initially relatively similarly expressed, they dip in cavefish at 7 dpci. From 7 dpci onwards, there is a steady increase until at least 30 dpci (g). Expression of MAS genes follows a similar pattern as TCA/OXPHOS expression (h). i,j, Significant positive correlation between the MAS and Glycolysis at late timepoints in surface fish (h) but not in cavefish (i). km, Expression over time in bulk RNA-seq data of two genes correlating to embcmhc expression in zebrafish, acta1 (k) and tnnc1a (l), showing strong upregulation at late timepoints in surface fish but much lower and shorter upregulation in cavefish. Mature marker myl7 expression reduces in the first days after injury, before increasing again from 7 dpci onwards (m). Selected significance is shown. n, Heatmap of sarcomere and myosin-related genes correlating to acta1, tnnc1a or myl7 in surface fish. Timepoints of interest are highlighted with black box. a,b, n = 5 biological replicates per morph per timepoint; g,h,km, n = 3 for uninjured cavefish and surface fish, n = 5 per morph for all other timepoints (biological replicates). a,b, Analysis performed using Metascape. cf,i,j, Simple linear regression. g,h,km, Two-way ANOVA with Sidakʼs multiple test; data presented as mean ± s.e.m. pos., positively. SF, surface fish.

Acknowledgments
This image is the copyrighted work of the attributed author or publisher, and ZFIN has permission only to display this image to its users. Additional permissions should be obtained from the applicable author or publisher of the image. Full text @ Nat Cardiovasc Res