Figure Caption
Fig. 3
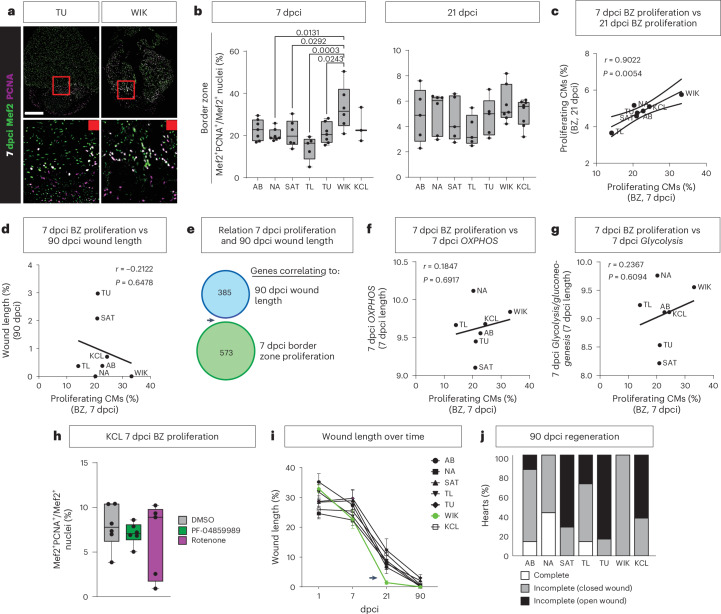
OXPHOS is not required for cardiomyocyte proliferation.
a, Representative images of immunofluorescence staining showing Mef2+PCNA+ double-positive proliferating cardiomyocytes in TU and WIK at 7 dpci. Framed areas highlight the wound border zone (red) (scale bar, 300 μm). b, Quantification of Mef2+PCNA+ double-positive cells showing differences in proliferating cardiomyocytes in the border zone at 7 dpci but not at 21 dpci. c, Positive correlation of percentage of proliferating cardiomyocytes in the border zone between 7 dpci and 21 dpci. d, No correlation between 7 dpci border zone proliferation and 90 dpci wound length. e, Venn diagram displaying complete lack of overlap between genes correlating to 7 dpci border zone proliferation and 90-dpci wound length. f,g, No correlation between border zone proliferation and OXPHOS (f) or Glycolysis (g) at 7 dpci. h, Quantification of Mef2+PCNA+ cells showing no difference in proliferating cardiomyocytes in the border zone of 7 dpci KCL adult treated with inhibitor PF-04859989 or rotenone compared to DMSO control. i, Temporal wound length reduction of all strains between 1, 7, 21 and 90 dpci. Arrow highlighting the strong decrease in wound length in WIK between 7 dcpi and 21 dpci. j, Percentage of hearts completely regenerated at 90 dpci or with closed compact wall but remaining internal scar or with open compact wall and internal scar remaining. b, 7 dpci: AB, NA, TU n = 7; SAT, WIK n = 6; TL n = 5; KCL n = 3, 21 dpci: AB, SAT, TL, TU n = 5; NA n = 6; WIK n = 7; KCL n = 8 (biological replicates); h, PF-04859989, DMSO n = 6, rotenone n = 5 (biological replicates); i, AB: 1, 90 dpci n = 7; 7 dpci n = 8; 21 dpci n = 6. NA: 1, 7, 90 dpci n = 7; 21 dpci n = 11. SAT: 1, 7, 21, 90 dpci n = 7. TL: 1, 7, 90 dpci n = 7; 21 dpci n = 9. TU: 1, 7 dpci n = 7; 21 dpci n = 5; 90 dpci n = 6. WIK: 1, 7, 21, 90 dpci n = 7. KCL: 1, 7, 21, 90 dpci n = 8 (biological replicates); j, AB, NA, SAT, TL, WIK n = 7; TU n = 6; KCL n = 8. b,h, One-way ANOVA with Tukey’s test. c,d,f,g, Simple linear regression. h, Two-way ANOVA with Tukey’s test. i, Data presented as mean ± s.e.m. Mef2, myocyte enhancer factor 2; PCNA, proliferating cell nuclear antigen.
Source data
Acknowledgments
This image is the copyrighted work of the attributed author or publisher, and
ZFIN has permission only to display this image to its users.
Additional permissions should be obtained from the applicable author or publisher of the image.
Full text @ Nat Cardiovasc Res