
- Title
-
Retinopathy-associated inosine monophosphate dehydrogenase 1 mutations cause metabolic and filament defects in cones
- Authors
- Rutter, K.M., Giarmarco, M.M., Truong, V., Wang, Y., Eminhizer, M., Xiang, Y., Cleghorn, W.M., Sanchez, G., Burrell, A.L., Kollman, J.M., Du, J., Brockerhoff, S.E.
- Source
- Full text @ Dis. Model. Mech.
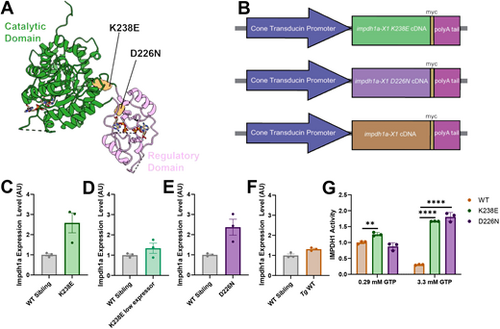
Zebrafish impdh1a transgenic line generation. (A) Two disease-associated IMPDH1 mutations (orange) on IMPDH1 monomer that were stably expressed in zebrafish. (B) Schematic describing the transgenic zebrafish lines. All lines are under a cone transducin promoter, and have a myc tag and a polyA tail. Mutant (K238E or D226N) or wild-type (WT) impdh1a cDNA were injected. (C) impdh1a expression in 7 days post fertilization (dpf) zebrafish larval eyes expressing K238E impdh1a mutation or WT sibling larval eyes. n=3 for K238E and WT siblings. Error bars are s.e.m. (D) impdh1a expression in 7 dpf zebrafish larval eyes expressing K238E impdh1a mutation or WT sibling larval eyes. n=3 for K238E and WT siblings. Error bars are s.e.m. (E) impdh1a expression in 7 dpf zebrafish larval eyes expressing D226N impdh1a mutation or WT sibling larval eyes. n=3 for D226N and WT siblings. Error bars are s.e.m. (F) impdh1a expression in 7 dpf zebrafish larval eyes expressing WT impdh1a or WT sibling larval eyes. n=3 for WT impdh1a and WT siblings. Error bars are s.e.m. (G) Purified Impdh1 protein activity assay. Protein activity in zebrafish with K238E and D226N mutations is not inhibited by high concentrations of GTP (P=9.0×10⁹ for K238E and P=5.0×10⁵ for D226N). Protein activity in zebrafish with K238E mutation is significantly higher at 0.29 mM GTP than for WT Impdh1a protein (P=0.003). n=3 for WT, K238E and D226N. **P<0.005, ****P<0.00005 (unpaired two-tailed t-test). Error bars are s.d. AU, arbitrary units. |
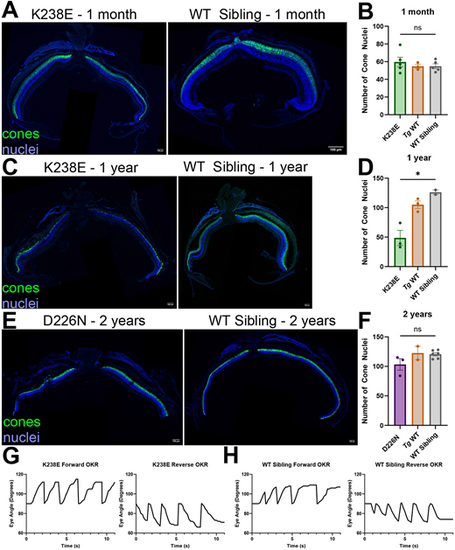
Zebrafish with K238E mutation have severe cone degeneration by 1 year of age, whereas those with D226N mutation do not show significant signs of cone degeneration by 2 years. (A) A 1-month-old zebrafish with K238E mutation (left) shows no signs of degeneration compared to a WT sibling (right). Cone cytosol is in green (gnat2:EGFP with anti-GFP antibody), and nuclei are in blue. Scale bars: 100 µm. (B) Cone nuclei were counted across one-third of the dorsal side of the retina. There was no significant change in cone nuclei for zebrafish with K238E mutation compared with those in WT siblings at 1 month. n=5 for K238E and WT siblings, n=3 for transgenic wild type (Tg WT). ns, not significant (P=0.45) (unpaired two-tailed t-test). Error bars are s.e.m. (C) A zebrafish with K238E mutation has significant cone loss by 1 year of age (left) compared to that in a WT sibling (right). Cone cytosol is in green (gnat2:EGFP with anti-GFP antibody), and nuclei are in blue. Scale bars: 100 µm. (D) Cone nuclei count of zebrafish expressing K238E IMPDH1 mutation or WT siblings. There were significantly fewer cone nuclei in zebrafish expressing K238E impdh1a mutation compared to those in WT siblings. n=3 for K238E and Tg WT, n=2 for WT sibling. *P=0.019 (unpaired two-tailed t-test). Error bars are s.e.m. (E) A 2-year-old zebrafish with D226N mutation (left) shows no signs of degeneration compared to a WT sibling (right). Cone cytosol is in green (gnat2:EGFP with anti-GFP antibody), and nuclei are in blue. Scale bars: 100 µm. (F) Cone nuclei were counted across one-third of the dorsal side of the retina. There was no significant change in cone nuclei for zebrafish with D226N mutation compared with those in WT sibling at 2 years. n=3 for D226N, n=2 for Tg WT and n=6 for WT sibling. ns, not significant (P=0.057) (unpaired two-tailed t-test). Error bars are s.e.m. (G) Optokinetic response (OKR) traces for zebrafish larvae containing K238E impdh1a mutation. Zebrafish larvae have forward (left) and reverse (right) OKR response at 5 dpf. (H) OKR traces for WT siblings to zebrafish larvae containing K238E impdh1a mutation. Zebrafish larvae have forward (left) and reverse (right) OKR response at 5 dpf. |
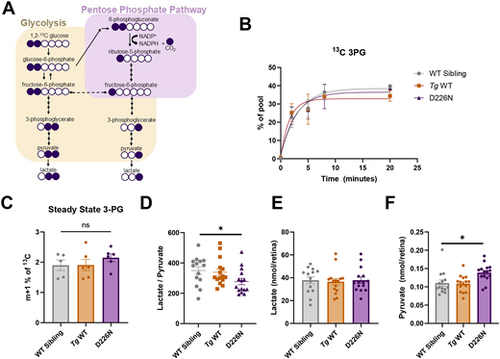
Glucose usage remains unchanged in zebrafish with D226N Impdh1a mutation. (A) Schematic illustrating the labeling pattern using 1,2 13C glucose. If glucose goes through glycolysis, two heavy carbons remain, whereas if glucose is diverted to the pentose phosphate pathway, only one heavy carbon remains. (B) Accumulation of 13C 3PG over time. There are no differences in levels of labeled 3PG over time between D226N, Tg WT or WT sibling zebrafish retinas. n=3 for all time points and groups except WT sibling at 8 h time point (n=2). Error bars are s.e.m. (C) Steady-state levels of pentose phosphate-derived 3PG (m+1). D226N mutation did not increase glucose diversion to pentose phosphate pathway. n=5 for WT sibling, and n=6 for D226N and Tg WT. ns, not significant (P=0.27) (unpaired two-tailed t-test). Error bars are s.e.m. (D) Total lactate to pyruvate levels of D226N, Tg WT or WT sibling zebrafish retinas. Zebrafish with D226N mutation have a lower lactate to pyruvate ratio. n=14 for WT sibling, and n=15 for D226N and Tg WT. *P=0.036 (unpaired two-tailed t-test). Error bars are s.e.m. (E) Total lactate levels (nmol/retina) for D226N, Tg WT or WT sibling zebrafish retinas. There were no significant differences in total lactate levels. n=14 for WT sibling, and n=15 for D226N and Tg WT. Error bars are s.e.m. (F) Total pyruvate levels (nmol/retina) for D226N, Tg WT or WT sibling zebrafish retinas. Total pyruvate was higher in zebrafish with D226N impdh1a mutation than in WT siblings. *P=0.011 (unpaired two-tailed t-test). n=14 for WT sibling, and n=15 for D226N and Tg WT. Error bars are s.e.m. |
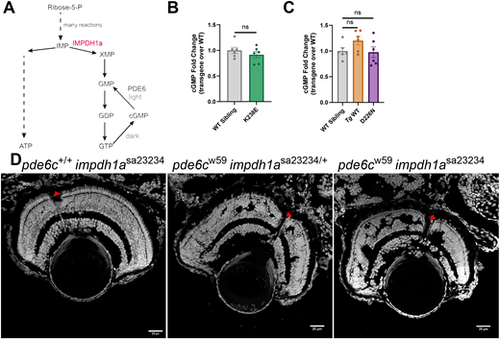
Altering Impdh1a does not affect cGMP levels. (A) Schematic of de novo purine biosynthesis of cGMP, with IMPDH1a highlighted in red. In the light, phosphodiesterase 6 (PDE6) converts cGMP into GMP. (B) Steady-state levels of cGMP from K238E mutant zebrafish or WT siblings. Zebrafish with class 1 mutant, K238E, do not have raised steady-state levels of cGMP. n=6 for both groups. ns, not significant (P=0.36) (unpaired two-tailed t-test). Error bars are s.e.m. (C) Steady-state levels of cGMP from Tg WT, D226N mutant or WT zebrafish. Zebrafish with class 1 mutant, D226N, do not have raised steady-state levels of cGMP. n=6 for all groups. ns, not significant (P=0.079 for Tg WT and P=0.85 for D226N) (unpaired two-tailed t-test). Error bars are s.e.m. (D) Larval optic nerve slices with nuclei stained with Hoechst. Scale bars: 25 µm. An Impdh1a KO zebrafish shows no signs of degeneration, whereas the Pde6c mutant has signs of severe degeneration at 5 dpf. The Pde6c mutant, Impdh1a KO zebrafish also shows signs of severe degeneration by 5 dpf. Knocking out Impdh1 did not rescue or delay degeneration of the model with high cGMP. Red arrowheads point to the cone layer. |
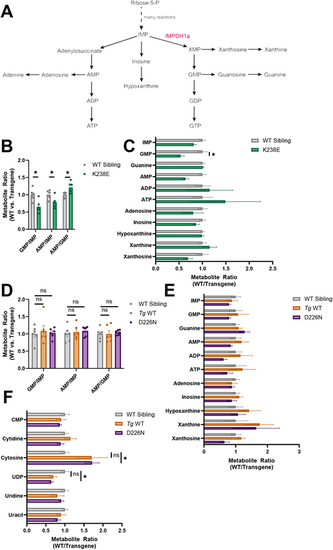
Purine or pyrimidine steady-state metabolite levels are affected in zebrafish with Impdh1a mutations. (A) Schematic showing de novo purine biosynthesis. IMPDH1a is highlighted in red. (B) Steady-state metabolite ratios in K238E mutant zebrafish compared to WT sibling eyes. GMP/IMP and AMP/IMP were lower in K238E mutant zebrafish compared to WT siblings (P=0.015 and P=0.027, respectively), whereas AMP/GMP was higher in K238E mutants (P=0.027). n=6 for both groups. Significance determined by unpaired two-tailed t-tests with Holm-Šídák correction for multiple comparisons. Error bars are s.e.m. (C) Ratio of purine-related metabolites for K238E mutant or WT sibling zebrafish eyes. GMP was significantly lower in K238E mutant zebrafish compared to WT siblings. n=6 for both groups. *P=0.048 (unpaired two-tailed t-tests with Holm-Šídák correction for multiple comparisons). Error bars are s.e.m. (D) Steady-state metabolite ratios in D226N mutant or Tg WT compared to WT sibling zebrafish retinas. Ratios in D226N mutant and Tg WT zebrafish retinas were not significantly different from those in WT sibling retinas. n=6 for all groups. ns, not significant (unpaired two-tailed t-tests with Holm-Šídák correction for multiple comparisons). Error bars are s.e.m. (E) Ratios of purine-related metabolites in D226N mutant, Tg WT or WT sibling zebrafish retinas. There were no significant differences in purine metabolites between mutant and WT retinas (unpaired two-tailed t-tests with Holm-Šídák correction for multiple comparisons). n=6 for all groups. Error bars are s.e.m. (F) Ratios of pyrimidine-related metabolites in D226N mutant, Tg WT or WT sibling zebrafish retinas. In retinas from D226N mutant zebrafish, cytosine was significantly higher (P=0.046), and UDP was significantly lower (P=0.049), than in WT sibling retinas, but there were no differences in cytosine (P=0.49) and UDP (P=0.26) between Tg WT and WT sibling retinas. n=6 for all groups. Significance determined by unpaired two-tailed t-tests with Holm-Šídák correction for multiple comparisons. Error bars are s.e.m. |
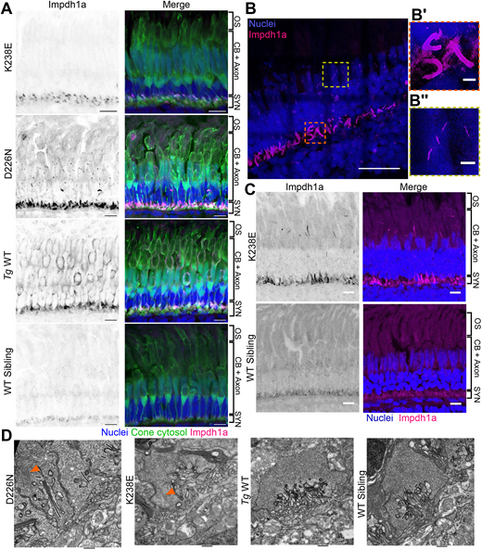
Filaments from zebrafish with Impdh1a mutations are larger and localized to synapses (K238E) or synapses and nuclei (D226N). (A) K238E Impdh1a mutant, D226N Impdh1a mutant, Tg WT or WT sibling zebrafish were crossed with TαCP:eGFP (cone cytosol, green), and retinal sections were stained with Hoechst (nuclei, blue) and a custom anti-Impdh1a antibody (magenta). K238E mutant zebrafish have larger filaments at cone synapses, and D226N mutant zebrafish have larger filaments at cone synapses and nuclei, whereas Tg WT zebrafish have diffuse cytosolic Impdh1a staining. Images show the cone layer. CB, cell bodies; OS, outer segment; SYN, synapses. Scale bars: 10 µm. (B) D226N Impdh1a mutant retinal sections expanded 5.5×. Nuclei (blue) and Impdh1a (magenta). B′ is a zoomed-in area of a cone synapse (orange dashed line box); B″ is a zoomed-in area of a Impdh1a-positive filament in cone nuclei (yellow dashed line box). Scale bars: 10 µm (B); 1 µm (B′,B″). All scale bars corrected by expansion factor (5.5). (C) K238E Impdh1a mutant (top) and WT sibling (bottom) zebrafish retinas stained with Hoechst (nuclei, blue) and a custom anti-Impdh1a antibody (magenta) at 4 months of age. The K238E mutant zebrafish retina has large filaments at the cone synapses and in cell bodies near the mitochondrial cluster, whereas the WT sibling retina has small Impdh1a filaments throughout the cell bodies and synapses. Images show the cone layer. Scale bars: 10 µm. (D) Transmission electron micrographs of cone synapses of D226N mutant, K238E mutant, Tg WT or WT sibling zebrafish. Zebrafish with Impdh1a D226N and K238E mutations have filamentous structures in synapses (orange arrowheads). Zebrafish eyes were taken prior to degeneration. Scale bars: 600 nm (D226N); 500 nm (others). |