
|
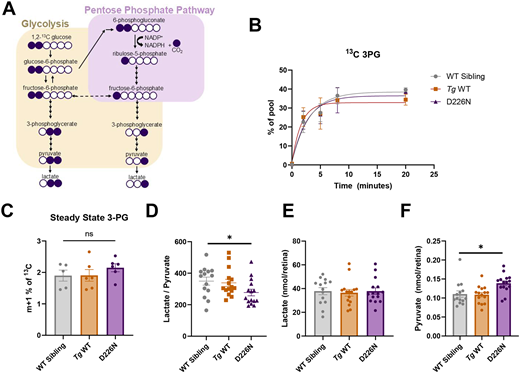
Fig. 3 Glucose usage remains unchanged in zebrafish with D226N Impdh1a mutation. (A) Schematic illustrating the labeling pattern using 1,2 13C glucose. If glucose goes through glycolysis, two heavy carbons remain, whereas if glucose is diverted to the pentose phosphate pathway, only one heavy carbon remains. (B) Accumulation of 13C 3PG over time. There are no differences in levels of labeled 3PG over time between D226N, Tg WT or WT sibling zebrafish retinas. n=3 for all time points and groups except WT sibling at 8 h time point (n=2). Error bars are s.e.m. (C) Steady-state levels of pentose phosphate-derived 3PG (m+1). D226N mutation did not increase glucose diversion to pentose phosphate pathway. n=5 for WT sibling, and n=6 for D226N and Tg WT. ns, not significant (P=0.27) (unpaired two-tailed t-test). Error bars are s.e.m. (D) Total lactate to pyruvate levels of D226N, Tg WT or WT sibling zebrafish retinas. Zebrafish with D226N mutation have a lower lactate to pyruvate ratio. n=14 for WT sibling, and n=15 for D226N and Tg WT. *P=0.036 (unpaired two-tailed t-test). Error bars are s.e.m. (E) Total lactate levels (nmol/retina) for D226N, Tg WT or WT sibling zebrafish retinas. There were no significant differences in total lactate levels. n=14 for WT sibling, and n=15 for D226N and Tg WT. Error bars are s.e.m. (F) Total pyruvate levels (nmol/retina) for D226N, Tg WT or WT sibling zebrafish retinas. Total pyruvate was higher in zebrafish with D226N impdh1a mutation than in WT siblings. *P=0.011 (unpaired two-tailed t-test). n=14 for WT sibling, and n=15 for D226N and Tg WT. Error bars are s.e.m.