FIGURE SUMMARY
Title

Vitamin A attenuates PFOS-induced neurotoxicity and alters early proximity patterns to conspecifics in zebrafish larvae

Authors
Jiang, P., Wang, J., Wang, X., Zou, L., Wu, D., Xu, Q., Jiang, Y., Yao, M., Hong, Q., Chi, X.
Source
Full text @ Front. Behav. Neurosci.

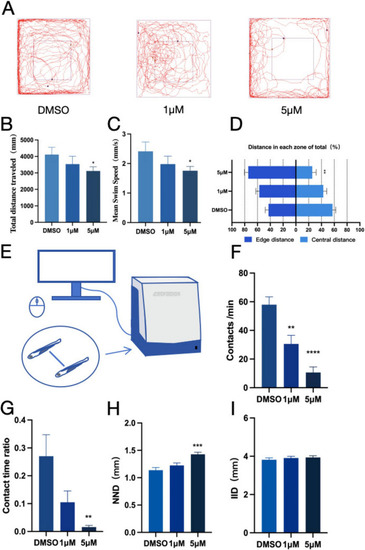
PFOS exposure causes anxiety-like behavior and social disturbance in zebrafish. (A) Open field path map of zebrafish. (B) Total distance of zebrafish open field movement (n = 10). (C) Average speed of zebrafish open field (n = 10). (D) The proportion of distance between central and marginal areas of zebrafish (Edge area distance ratio = outer distance/total distance, central area distance ratio = inner distance/total distance) (n = 10). (E) Diagram of a zebrafish social interaction experiment. (F) Zebrafish contacts per min (n = 12). (G) Zebrafish contact duration ratio (n = 12). (H) Zebrafish Minimum distance between two fish (n = 10). (I) Average distance between two zebrafish (n = 10). These data are expressed as mean ± SEM. *P < 0.05, **P < 0.01, ***P < 0.001, ****P < 0.0001 versus DMSO group.

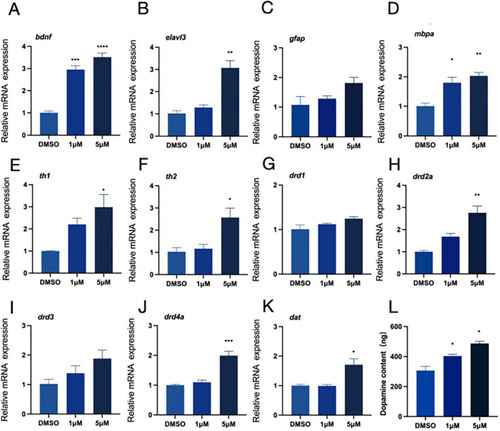
Neurodevelopment and relative expression of dopamine-related genes. RNA was extracted from at least 30 fish each time. (A–D) Expression of neurodevelopment-related genes (four genes, bdnf, elavl3, gfap and mbpa were detected). (E–K) The relative expression of genes related to dopamine pathway (th1, th2, drd1, drd2a, drd3, drd4a, and dat were detected). (L) Dopamine content (test and calculate according to ELISA kit). These data are expressed as mean ± SEM. *P < 0.05, **P < 0.01, ***P < 0.001, ****P < 0.0001 versus DMSO group.

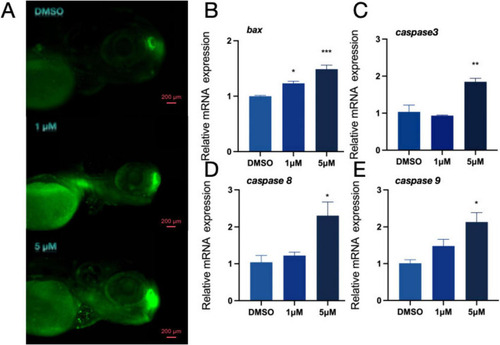
Effect of apoptosis pathway in zebrafish. (A) AO staining apoptotic corpuscles of zebrafish. (B–E) Relative expression of genes related to apoptosis pathway in zebrafishbdnf (bax, caspase-3, caspase8 and caspase-9 were detected) (n = 10). These data are expressed as mean ± SEM. *P < 0.05, **P < 0.01, ***P < 0.001 versus DMSO group.

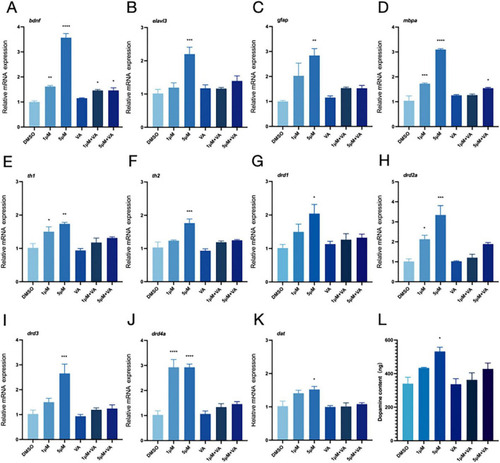
Vitamin A improves neurodevelopment and the relative expression of dopamine-related genes. DMSO was used as the control group in this experiment. The 1 μM group represented the exposure group with a PFOS concentration of 1 μM, and the 5 μM group represented the exposure group with a PFOS concentration of 5 μM. “VA” refers to the vitamin A group; 1 μM + VA denotes the vitamin A intervention group with a PFOS concentration of 1 μM, and 5 μM + VA denotes the vitamin A intervention group with a PFOS concentration of 5 μM. (A–D) Expression of neurodevelopment-related genes (four genes, bdnf, elavl3, gfap and mbpa were detected). (E–K) The relative expression of genes related to dopamine pathway (th1, th2, drd1, drd2a, drd3, drd4a and dat were detected). (L) Dopamine content (n = 30 per group). These data are expressed as mean ± SEM. *P < 0.05, **P < 0.01, ***P < 0.001, ****P < 0.0001 versus DMSO group.

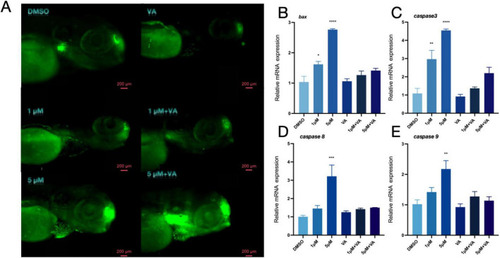
Vitamin A improves apoptosis of zebrafish. (A) AO staining apoptotic corpuscles of zebrafish. (B–E) Relative expression of genes related to apoptosis pathway in zebrafish (bax, caspase-3, caspase8 and caspase-9 were detected) (n = 10). These data are expressed as mean ± SEM. *P < 0.05, **P < 0.01, ***P < 0.001, ****P < 0.0001 versus DMSO group.

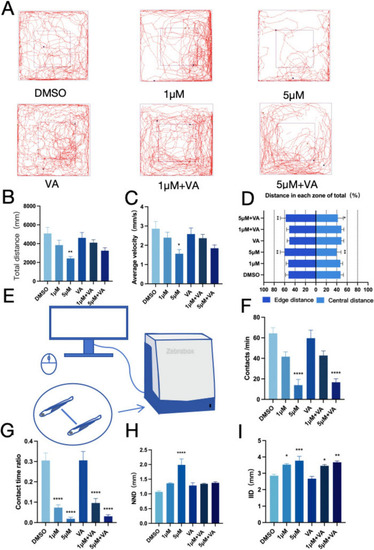
Zebrafish anxiety-like behavior and social interaction improved after vitamin A intervention. (A) Open field path map of zebrafish. (B) Total distance of zebrafish open field movement (n = 10). (C) Average speed of zebrafish open field (n = 10). (D) The proportion of distance between central and marginal areas of zebrafish (Edge area distance ratio = outer distance/total distance, central area distance ratio = inner distance/total distance) (n = 10). (E) Diagram of a zebrafish social interaction experiment. (F) Zebrafish contacts per min (Contact is defined as the distance between two fish ≤ one body length) (n = 12). (G) Zebrafish contact duration ratio (n = 12). (H) Zebrafish Minimum distance between two fish (n = 10). (I) Average distance between two zebrafish (n = 10). These data are expressed as mean ± SEM. *P < 0.05, **P < 0.01, ***P < 0.001, ****P < 0.0001 versus DMSO group.

Acknowledgments
This image is the copyrighted work of the attributed author or publisher, and ZFIN has permission only to display this image to its users. Additional permissions should be obtained from the applicable author or publisher of the image. Full text @ Front. Behav. Neurosci.