
- Title
-
Nance-Horan-syndrome-like 1b controls mesodermal cell migration by regulating protrusion and actin dynamics during zebrafish gastrulation
- Authors
- Escot, S., Hassanein, Y., Elouin, A., Torres-Paz, J., Mellottee, L., Ignace, A., David, N.B.
- Source
- Full text @ Commun Biol
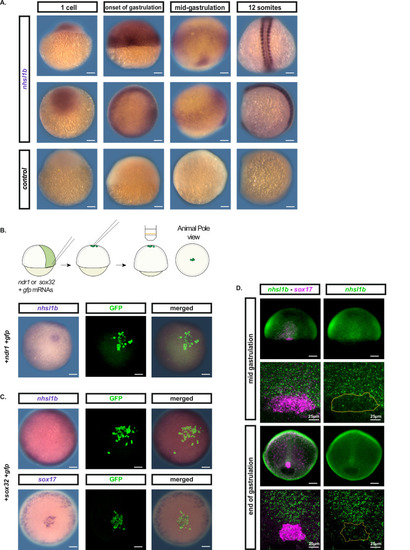
EXPRESSION / LABELING:
|
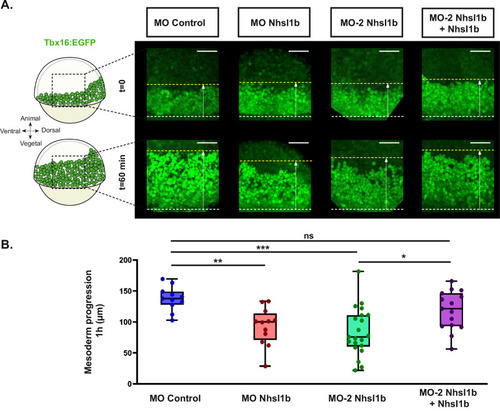
PHENOTYPE:
|
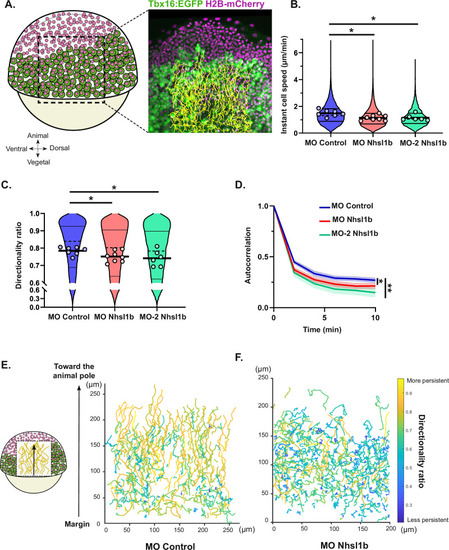
PHENOTYPE:
|
|
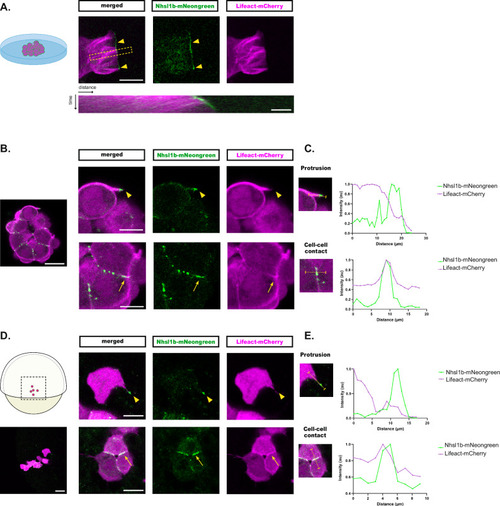
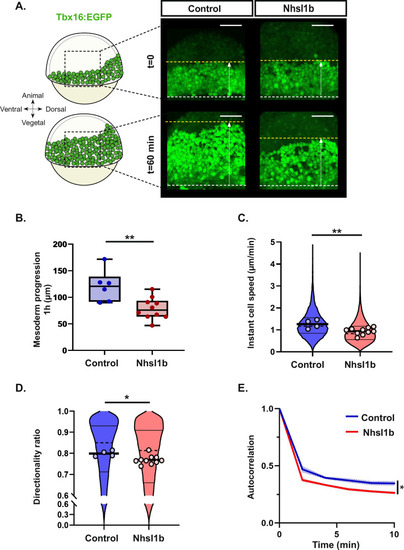
Nhsl1b localises at cell-cell contacts and at the tip of actin-rich protrusions. Nhsl1b-mNeongreen and Lifeact-mCherry expressing mesodermal cells plated on a coverslip ( |
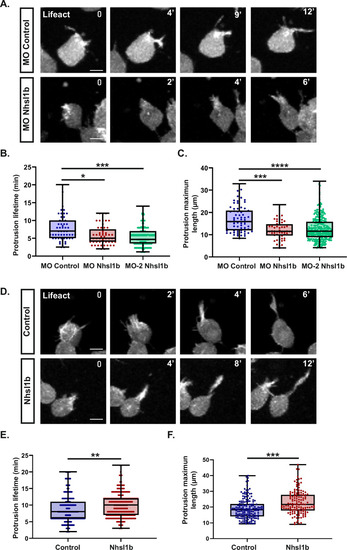
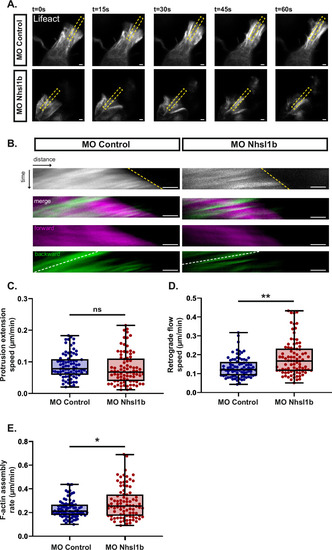
Nhsl1b regulates protrusion dynamics. |
|