
- Title
-
Fosab, but not fosaa, plays important role in learning and memory in fish-insights from zebrafish gene knockout study
- Authors
- Wang, Q., Zhang, L., Zhu, C., Lu, K., Wu, J., Liang, X.F.
- Source
- Full text @ Front Cell Dev Biol
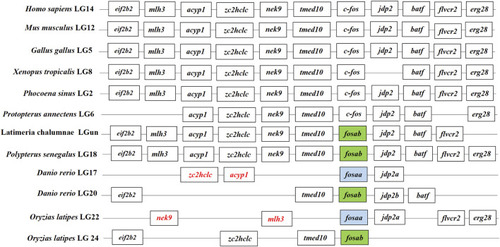
Synteny analysis of |
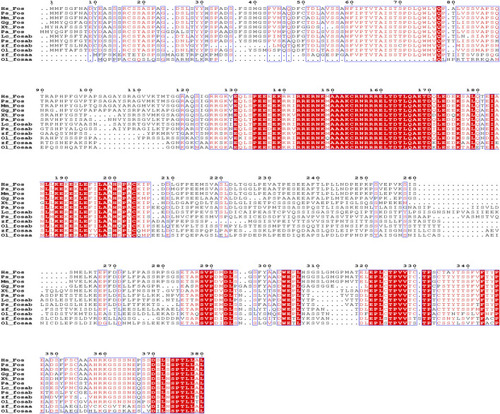
Sequence alignment of human ( |
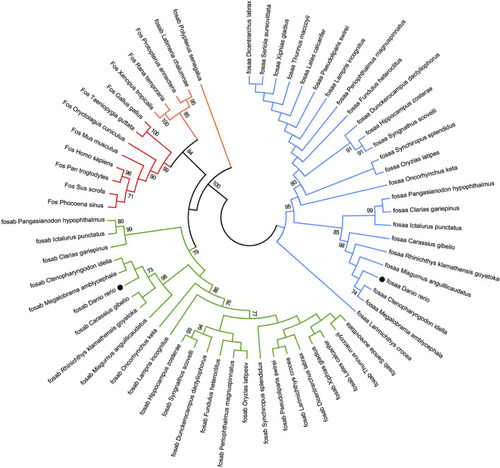
The Neighbor-joining tree based on the Fos proteins. The tree was built by the JTT model bootstrap method with 1,000 replications. The lines with the same color (red, blue or green) belong to one branch. The zebrafish |
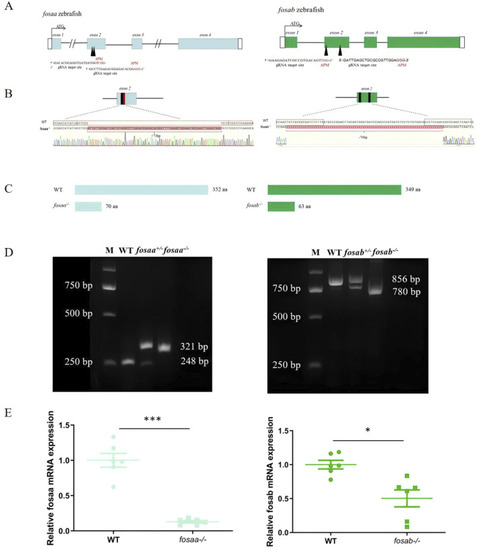
Generation of |
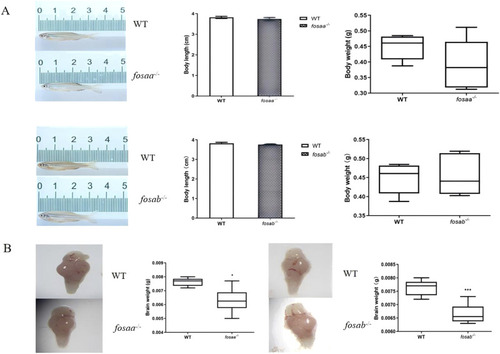
Growth performance and brain weight were observed in |
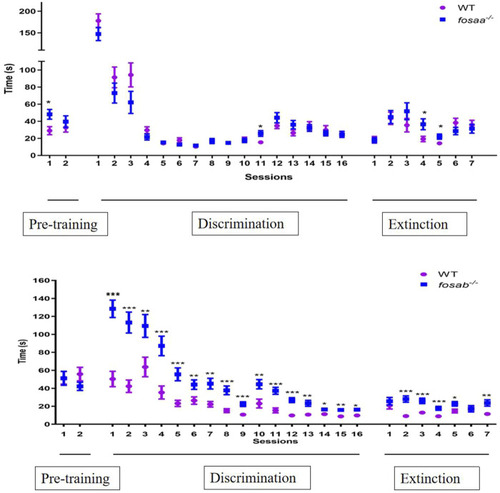
The average time required by zebrafish to complete trials in pre-training (2 days), discrimination learning training (16 days) and decision test (7 days). The data represented by mean ± SEM (n = 6). *, **, *** indicated significant differences ( |
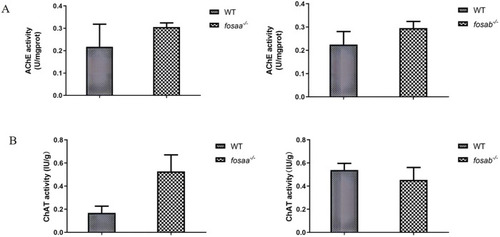
The acetylcholinesterase (AChE) acetylcholine and transferase (AChT) activity in the brain of WT, |
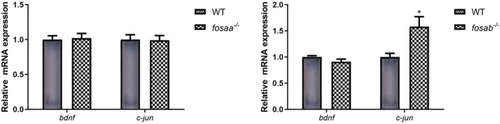
Relative mRNA expression of t of |