
- Title
-
2-Ethylhexanol induces autism-like neurobehavior and neurodevelopmental disorders in zebrafish
- Authors
- Eghan, K., Lee, S., Yoo, D., Kim, W.K.
- Source
- Full text @ J. Hazard. Mater.
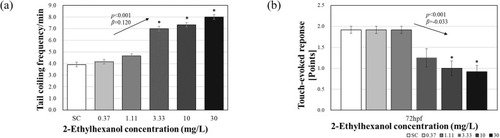
Tail coiling (a) recorded at 24 h and touch-evoked response (b) recorded at 72 h 2-ethylhexanol exposure. The results are shown as the mean ± standard error of the mean (N = 12). The arrows shown in the figure denote a significant trend of the slope (p: p-value, β: slope). Asterisks (*) indicate significant differences compared with the control (p < 0.05). |
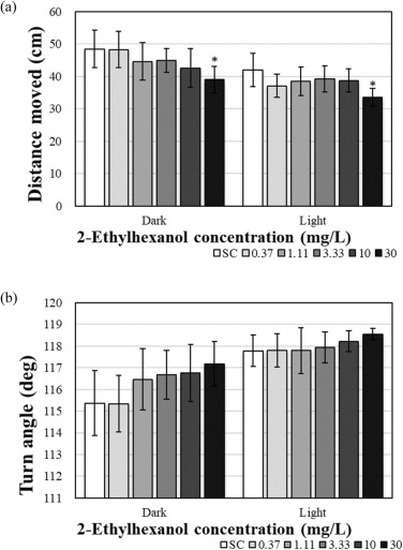
Individual behavior activity ((a) distance moved and (b) turn angle), of zebrafish larvae after 120 h 2-ethylhexanol exposure. The results are shown as the mean ± standard error of the mean (N = 12). Significant differences were determined for each phase. Asterisks (*) indicate significant differences compared with the control (p < 0.05). |
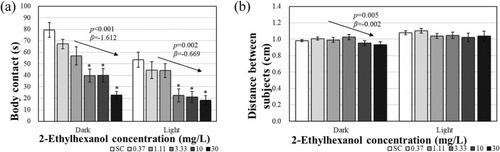
Social behavior activity ((a) body contact, and (b) distance between zebrafish larvae after 120 h 2-ethylhexanol exposure. Results are shown as the mean ± standard error of the mean (N = 3, 5 larvae per replicate). The arrows shown in the figure denote a significant trend of the slope (p: p-value, β: slope). Significant differences were determined for each phase. Asterisks (*) indicate significant differences compared with the control (p < 0.05). |
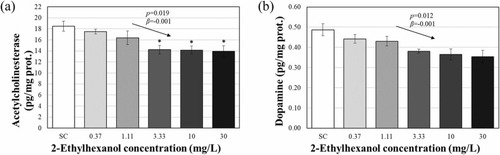
ELISA results for AChE (a) and DA (b) after 120 h 2-ethylhexanol exposure. The results are shown as the mean ± standard error of the mean (N = 3). The arrows shown in the figure denote a significant trend of the slope (p: p-value, β: slope). Asterisks (*) indicate significant differences compared with the control (p < 0.05). |
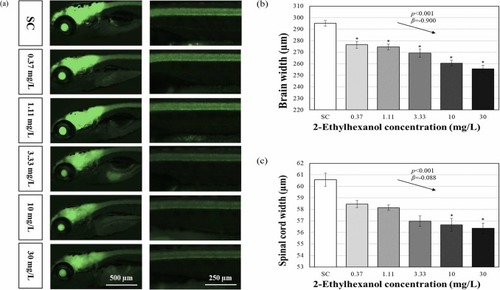
Fluorescent images of tg(elavl3:eGFP) line (a) showing brain width (b) and spinal cord width (c) results after 120 h 2-ethylhexanol exposure. The results are shown as the mean ± standard error of the mean (N = 6). The arrows shown in the figure denote a significant trend of the slope (p: p-value, β: slope). Asterisks (*) indicate significant differences compared with the control (p < 0.05). |
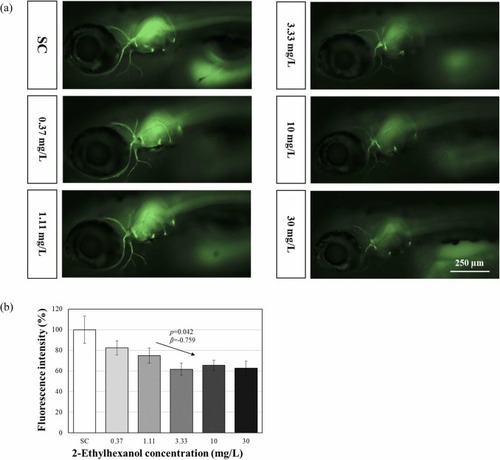
Fluorescent images of tg(mbp:mGFP) line (a) and fluorescent intensity (b) results after 120 h 2-ethylhexanol exposure. The results are shown as the mean ± standard error of the mean (N = 6). The arrows shown in the figure denote a significant trend of the slope (p: p-value, β: slope). Asterisks (*) indicate significant differences compared with the control (p < 0.05). |
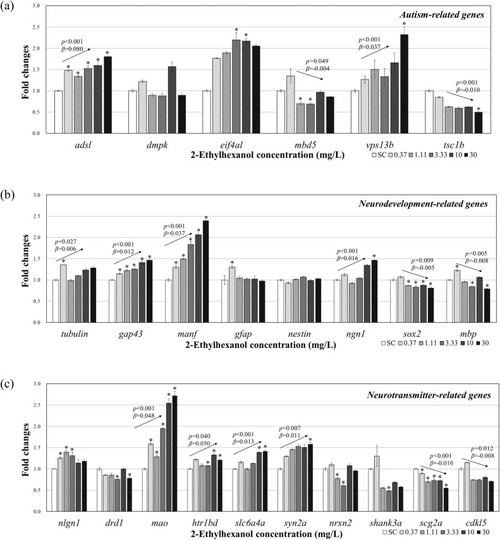
Gene transcription changes in whole-body homogenates of zebrafish larvae after 120 h of 2-ethylhexanol exposure ((a) Autism-related genes (b) Neurodevelopment-related genes (c) Neurotransmitter-related genes). The results are shown as the mean ± standard error of the mean (N = 4). The arrows shown in the figure denote a significant trend of the slope (p: p-value, β: slope). Asterisks (*) indicate significant differences compared with the control (p < 0.05). |
Reprinted from Journal of hazardous materials, 488, Eghan, K., Lee, S., Yoo, D., Kim, W.K., 2-Ethylhexanol induces autism-like neurobehavior and neurodevelopmental disorders in zebrafish, 137469137469, Copyright (2025) with permission from Elsevier. Full text @ J. Hazard. Mater.