
Image
|
Figure Caption
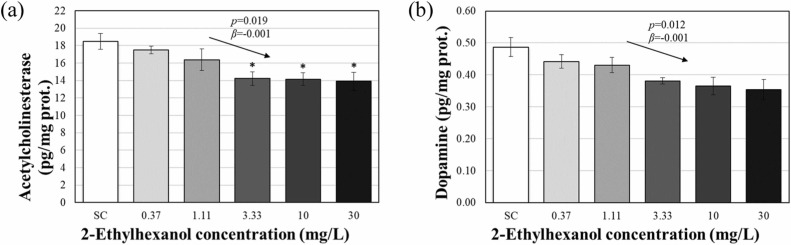
Fig. 4 ELISA results for AChE (a) and DA (b) after 120 h 2-ethylhexanol exposure. The results are shown as the mean ± standard error of the mean (N = 3). The arrows shown in the figure denote a significant trend of the slope (p: p-value, β: slope). Asterisks (*) indicate significant differences compared with the control (p < 0.05).
Acknowledgments
This image is the copyrighted work of the attributed author or publisher, and
ZFIN has permission only to display this image to its users.
Additional permissions should be obtained from the applicable author or publisher of the image.
Reprinted from Journal of hazardous materials, 488, Eghan, K., Lee, S., Yoo, D., Kim, W.K., 2-Ethylhexanol induces autism-like neurobehavior and neurodevelopmental disorders in zebrafish, 137469137469, Copyright (2025) with permission from Elsevier. Full text @ J. Hazard. Mater.