
- Title
-
Zebrafish Cyp1b1 knockout alters eye and brain metabolomic profiles, affecting ocular and neurobehavioral function
- Authors
- Perone, D.M., Annalora, A.J., Goldstone, J.V., Dickey, A.N., Salanga, M.C., Francolini, R.D., Wright, F.A., Marcus, C.B., Tanguay, R.L., Garcia-Jaramillo, M.
- Source
- Full text @ Tox. App. Pharmacol.
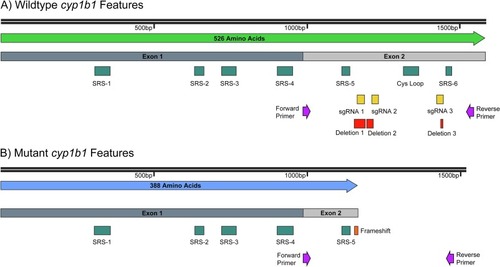
A) Wildtype Cyp1b1 exon structure, substrate recognition sites (SRSs), and the cysteine ligand containing Cys loop are shown. Additionally, forward & reverse primer location, sgRNA target sites, and deletion positions against the WT coding sequence are shown. B) Mutant Cyp1b1 exon structure is shown. Additionally, forward & reverse primer location and frameshift mutation position proceeding the early stop codon against the mutant coding sequence are shown. The Cys loop containing the heme-binding cysteine ligand and SRS-6 are lost. |
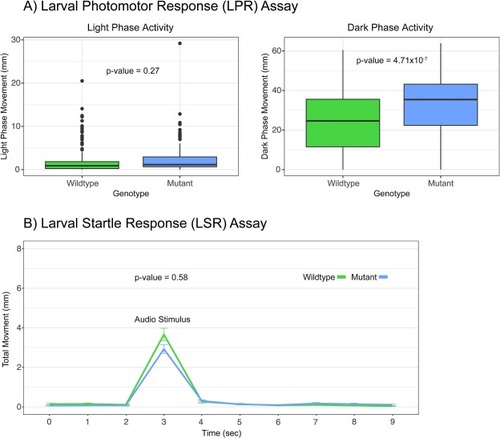
A) Box plots of the larval photomotor response (LPR) assay. The movement in mm during the first light phase is shown in the left figure while movement in the first dark phase is shown in the right figure. CYP1B1 mutant 5dpf larvae did not behave differently during the light phase of the assay but were hyperactive during the dark portion of the assay. P-values = 0.27 and 4.71x10⁻⁷, n = 180, one-way ANOVA. The data within the interquartile range (IQR) was represented by the box, the whiskers represented data 1.5 times the IQR, and any data point beyond that appears as a dot. B) Larval startle response (LSR) assay plotted as time in sec vs total movement in mm. Zebrafish are subjected to an audio stimulus at 3 seconds and should move in response. Response is calculated as area under the curve for the entire period shown. CYP1B1 mutant 5dpf larvae did not behave significantly different during the LSR assay. P-value = 0.58, n = 180, one-way ANOVA. PHENOTYPE:
|
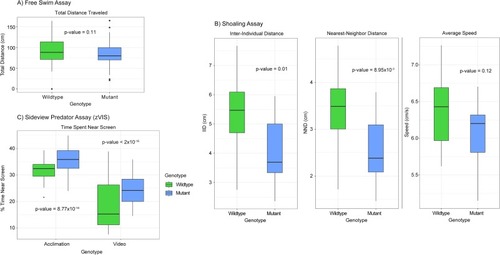
A) Box plot of the free swim assay. A single fish is placed in the tank and allowed to swim without interruption while its movement is tracked. The total distance swam is displayed on the y-axis and measured in cm. There was no significant difference between the genotypes when measuring total distance traveled. P-value = 0.11, n = 62 WT and 56 mutant, one-way ANOVA. For all the following box plots the data within the interquartile range (IQR) was represented by the box, the whiskers represented data 1.5 times the IQR, and any data point beyond that appears as a dot. B) Box plots of the shoaling assay. Four fish (two male and two female) are placed in the tank and allowed to swim without interruption while movement is tracked. Three metrics of behavior are tracked: inter-individual distance (IID-the average distance between all fish in cm), nearest-neighbor distance (NND-the average distance between the two nearest fish in cm), and average speed measured in cm/s. A significant difference in both IID and NND was observed between genotypes. No significant difference was observed when measuring average speed. P-value = 0.01, 8.95x10⁻³, and 0.12, n = 16 WT and 12 mutant, one-way ANOVA. C) Box plot of the sideview predator assay (zVIS). A single fish is placed in a tank near a computer screen. During the acclimation period no image is displayed on the screen, but during the video period a natural predator of the zebrafish is shown. The movement of the fish is tracked during both periods and percent time spent in the 1/3 of the tank nearest the screen is calculated as % time near screen. Mutant zebrafish performed differently during both the acclimation and the video portion of the assay spending more time closer to the screen when compared to the wildtype. P-value = 8.77x10⁻¹⁴ and < 2x10-16, n = 61 WT and 57 mutant, three-way ANOVA. PHENOTYPE:
|
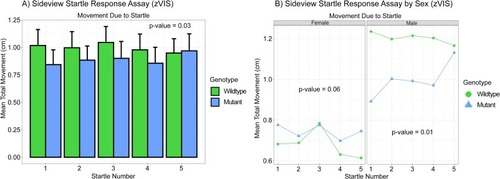
A) Bar graph of the sideview startle response assay (zVIS). This assay takes place following the sideview predator assay. A single fish’s movement in tracked during 10 consecutive mechanical vibrations every 20 s. Mean total movement during each of the taps is calculated and measured in cm. The first five taps are displayed. There was a significant difference between the genotypes when measuring mean total movement due to the startle (vibration). P-value = 0.03, n = 61 WT and 57 mutant, two-way ANOVA. B) Line graph of sideview startle response assay by sex (zVIS). There was a significant difference between the sexes when measuring mean total movement due to the startle (vibration). P-value = 1.82x10⁻⁵, n = 61 WT and 57 mutant, three-way ANOVA. When analyzed alone females did not exhibit statistically significant changes in behavior while males did. P-value = 0.06 and 0.01, two-way ANOVA. PHENOTYPE:
|
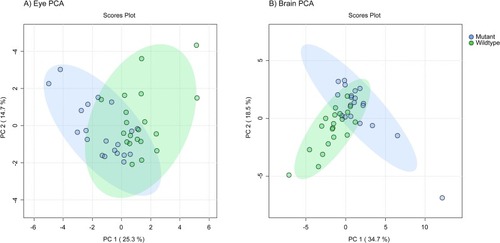
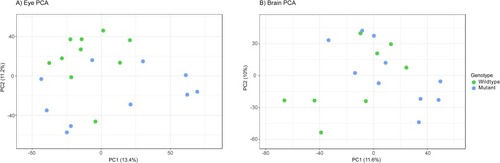
Principal component analysis (PCA) plot based on untargeted metabolomics features from wildtype and mutant adult zebrafish A) eye and B) brain samples. 95% confidence interval ellipses represented by shading. There was modest separation between the WT and mutant samples. |
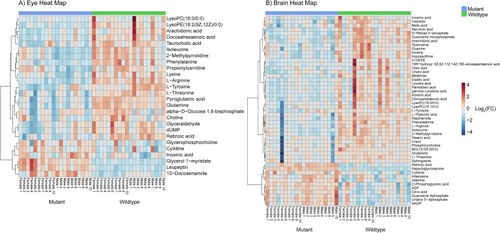
Heat map of the features in differential abundance between wildtype and mutant adult zebrafish A) eye and B) brain samples (p-value < 0.05 FDR, n = 20, non-parametric t-test). Features ordered via hierarchal clustering using Ward’s method and the key displays log2(fold change). 26 and 49 biologically relevant metabolites were found to be in differential abundance in the eye and brain, respectively. |
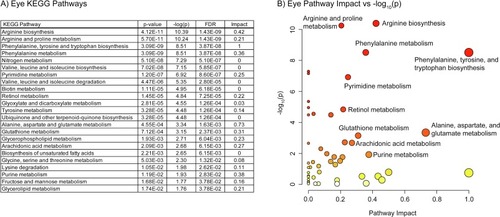
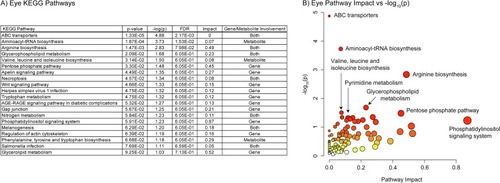
A) Table of the 23 significantly perturbed KEGG pathways in the eye (p-value < 0.05 FDR, n=20, weighted z-test). B) Plot of KEGG pathway impact score vs pathway -log10(p). Pathway impact is represented by size (larger size = greater impact) while -log10(p) is represented by color (white = low and red = high). |
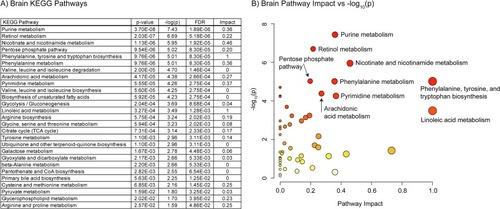
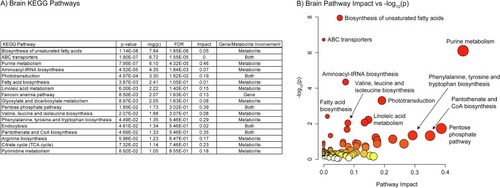
A) Table of the 27 significantly perturbed KEGG pathways in the brain (p-value < 0.05 FDR, n=20, weighted z-test). B) Plot of KEGG pathway impact score vs pathway -log10(p). Pathway impact is represented by size (larger size = greater impact) while -log10(p) is represented by color (white = low and red = high). |
Principal component analysis (PCA) plot based on RNA sequencing of wildtype and mutant adult zebrafish A) eye and B) brain samples. There was little separation between the WT and mutant samples. |
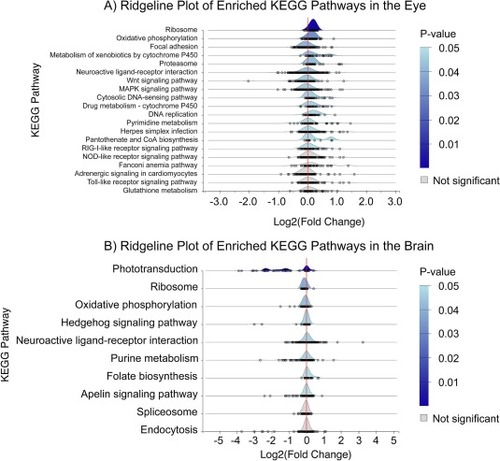
A) KEGG pathways enriched using gene set enrichment analysis of mutant vs wildtype eyes (raw p-values with 0.05 cutoff, n=10, GSEA). Each point under the curve represents an individual gene and its fold change. There were 15 perturbed pathways when considering raw p-value, however only the top two were significant when considering adj. p-value. B) KEGG pathways enriched using a gene set enrichment analysis of mutant vs wildtype brains (raw p-values with 0.05 cutoff, n= 10 & 8 respectively, GSEA). Each point under the curve represents an individual gene and its fold change. There were eight perturbed pathways when considering raw p-value, however only the top three were significant when considering adj. p-value. |
A) Table of KEGG pathways in the eye with raw p-value < 0.1 (n=20, weighted z-test). B) Plot of KEGG pathway impact score vs pathway -log10(p). Pathway impact is represented by size (larger size = greater impact) while -log10(p) is represented by color (white = low and red = high). There were 11 perturbed pathways when considering raw p-value, however only two were significant when using an FDR method. |
A) Table of KEGG pathways in the brain with raw p-value < 0.1 (n=20, weighted z-test). B) Plot of KEGG pathway impact score vs pathway -log10(p). Pathway impact is represented by size (larger size = greater impact) while -log10(p) is represented by color (white = low and red = high). There were 14 perturbed pathways when considering raw p-value, however only five were significant when using an FDR method. |