
Image
|
Figure Caption
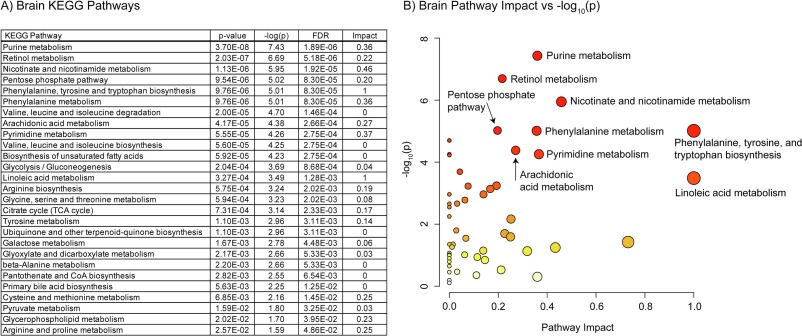
Fig. 8 A) Table of the 27 significantly perturbed KEGG pathways in the brain (p-value < 0.05 FDR, n=20, weighted z-test). B) Plot of KEGG pathway impact score vs pathway -log10(p). Pathway impact is represented by size (larger size = greater impact) while -log10(p) is represented by color (white = low and red = high).
Acknowledgments
This image is the copyrighted work of the attributed author or publisher, and
ZFIN has permission only to display this image to its users.
Additional permissions should be obtained from the applicable author or publisher of the image.
Full text @ Tox. App. Pharmacol.