
- Title
-
Establishment and application of a zebrafish model of Werner syndrome identifies sapanisertib as a potential antiaging drug
- Authors
- Ma, J., Chen, Y., Song, J., Ruan, Q., Li, L., Luo, L.
- Source
- Full text @ Proc. Natl. Acad. Sci. USA
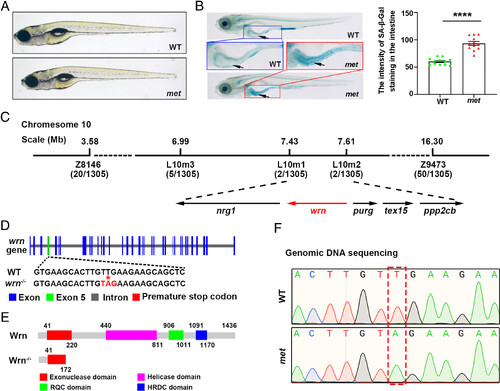
The met mutant with wrn gene mutation exhibits cellular senescence. (A) Bright-field images showing the morphological appearance of WT and met mutants at 8 dpf. (B) Representative image of SA-β-Gal staining and quantification of the intensity of SA-β-Gal staining in the intestine at 8 dpf (n = 12 for each group). Arrows indicate the intestine region. (C) Genetic map of the candidate region on chromosome 10. Numbers below SSLP indicate recombination events. (D) Diagram showing the genomic structure of wrn between WT and met. (E) Schematic representation of the change in function domains of Wrn between WT and met. (F) The genomic sequencing results displaying the mutation site in wrn. Note that the T to A transition (red dashed box) leading a premature stop codon within the coding region in the met mutant. Data are presented as mean ± SEM. Significance was determined by the unpaired t test. ****P < 0.0001. BF, bright-field; dpf, day postfertilization; WT, wild type; SSLP, simple sequence length polymorphism. PHENOTYPE:
|
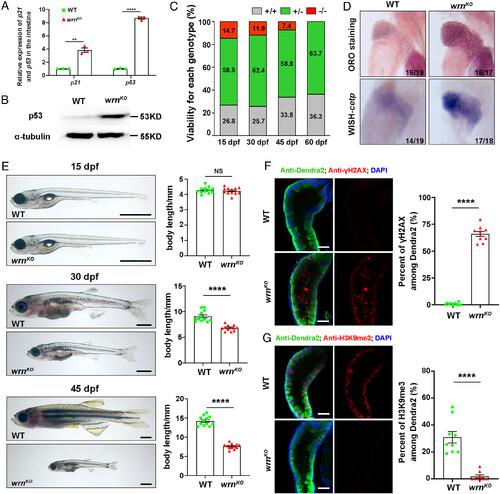
The zebrafish wrnKO mutants recapitulate the age-related characteristics of WS patients. (A) qPCR analysis of age-related gene expression (p21 and p53) in intestinal samples at 8 dpf (n = 40 for each group). (B) Western blot images of p53 in WT and wrnKO mutant larvae in intestinal samples at 8 dpf (n = 40 for each group). (C) Viability for WT and wrnKO at 15 dpf, 30 dpf, 45 dpf, and 60 dpf. (D) ORO staining (Top) and WISH of cetp (Bottom) at 8 dpf in WT and wrnKO mutants. Numbers indicate the proportion of larvae exhibiting the expression shown. (E) Representative phenotypic images of WT and wrnKO mutants at the specified time points (15 dpf, 30 dpf, and 45 dpf) and quantification of the body length (n = 12 for each group). (F) Single-optical section images showing the expression of γH2AX (red), Dendra2 (green), and DAPI (blue) in the intestine of Tg(fabp2:Dendra2-NTR) between WT and wrnKO mutants at 8 dpf. Quantification of the percent of γH2AX (n = 10 for each group). (G) Single-optical section images showing the expression of H3K9me3 (red), Dendra2 (green), and DAPI (blue) in the intestine of Tg(fabp2:Dendra2-NTR) between WT and wrnKO mutants at 8 dpf. Quantification of the percent of H3K9me3 (n = 9 for each group). [Scale bars, 1 mm (E) and 50 μm (F and G).] Data are presented as mean ± SEM. Significance was determined by the unpaired t test. NS, not significant; **P < 0.01; ****P < 0.0001. ORO, whole-mount Oil Red O; WISH, whole-mount in situ hybridization. EXPRESSION / LABELING:
PHENOTYPE:
|
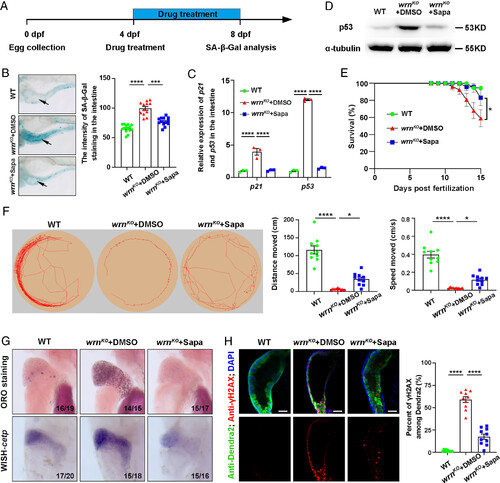
Drug screening identified that sapanisertib alleviated aging phenotypes in wrnKO mutants. (A) Schematic illustration of antiaging drug screening on the zebrafish wrnKO mutant. (B) Representative image of SA-β-Gal staining and quantification of the intensity of SA-β-Gal staining in the intestine at 8 dpf (n = 12 to 15 for each group). Arrows indicate the intestine region. (C) qPCR analysis of age-related gene expression (p21 and p53) in intestinal samples at 8 dpf (n = 40 for each group). (D) Western blot images of p53 in WT, wrnKO+DMSO, and wrnKO+Sapa groups in intestinal samples at 8 dpf (n = 40 for each group). (E) The percent of survival of the WT (n = 19), wrnKO+DMSO (n = 24), and wrnKO +Sapa (n = 18) groups from 0 dpf to 15 dpf is presented. (F) Representative swimming tracks (Left) and quantification of total distance traveled and swimming speed (Right) among WT, wrnKO + DMSO, and wrnKO +Sapa groups at 15 dpf (n = 10 for each group). The yellow circle represents the recording field, and the red line represents the swimming track. (G) ORO staining and WISH of cetp at 8 dpf. Numbers indicate the proportion of larvae exhibiting the expression shown. (H) Single-optical section images showing the expression of γH2AX (red), Dendra2 (green), and DAPI (blue) in the intestine of Tg(fabp2:Dendra2-NTR) at 8 dpf. Quantification of the percent of γH2AX (n = 10 for each group). (Scale bar, 50 μm.) Data are presented as mean ± SEM. Significance was determined by one-way ANOVA, and the survival rate was analyzed with the log-rank test. *P < 0.05; **P < 0.01; ***P < 0.001; ****P < 0.0001. Sapa, sapanisertib. EXPRESSION / LABELING:
PHENOTYPE:
|
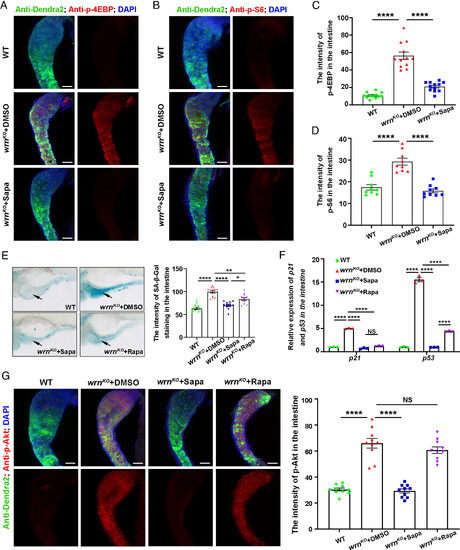
Sapanisertib may attenuate the aging phenotypes of the wrnKO mutant by inhibiting mTORC1/2 signaling. (A–D) Confocal projection images showing the expression of p-4EBP (A, red), p-S6 (B, red), Dendra2 (green), and DAPI (blue) in the intestine of Tg(fabp2:Dendra2-NTR) among WT, wrnKO + DMSO, and wrnKO + Sapa groups at 8dpf. Quantification of the intensity of p-4EBP (C, n = 12 for each group) and p-S6 (D, n = 9 for each group). (E) Representative image of SA-β-Gal staining and quantification of the intensity of SA-β-Gal staining in the intestine at 8 dpf (n = 11 to 14 for each group). Arrows indicate the intestine region. (F) qPCR analysis of age-related gene expression (p21 and p53) in intestinal samples at 8 dpf (n = 40 for each group). (G) Confocal projection images showing the expression of p-Akt (red), Dendra2 (green), and DAPI (blue) in the intestine of Tg(fabp2:Dendra2-NTR) among WT, wrnKO+DMSO, wrnKO+Sapa, and wrnKO+Rapa groups at 8dpf. Quantification of the intensity of p-Akt (n = 10 for each group). (Scale bar, 50 μm.) Data are presented as mean ± SEM. Significance was determined by one-way ANOVA. NS, not significant; *P < 0.05; **P < 0.01; ****P < 0.0001. Rapa, rapamycin. |
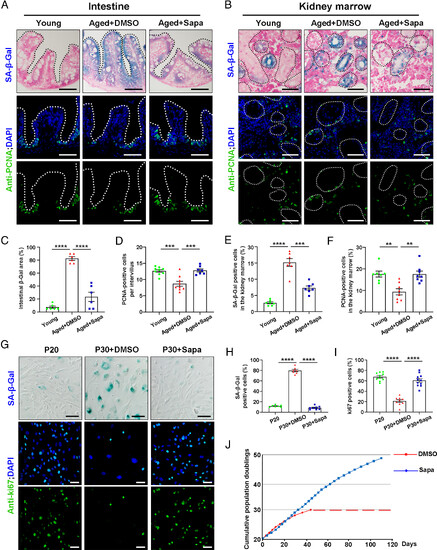
Sapanisertib alleviated aging phenotypes in both physiological-aging zebrafish and replicative-senescent HFF. (A and B) Representative images of SA-β-Gal staining (Top) and immunofluorescence sections images of proliferation staining (PCNA, Bottom) in the intestine (A) and kidney marrow (B) of young, aged+DMSO, and aged+Sapa groups. (C–F) Quantification of the percent of SA-β-Gal positive area in the intestine (C, n = 6 for each group) and kidney marrow (E, n = 7 for each group). Quantification of the PCNA-positive cells per intervillus in the intestine (D, n = 7 to 9 for each group) and the percent of PCNA-positive cells among kidney marrow (F, n = 7 to 8 for each group). (G) Representative image of SA-β-Gal staining and immunofluorescence images of proliferation staining (ki67) in HFF cells of P20, P30+DMSO, and P30+Sapa groups. (H and I) Quantification of the percent of SA-β-Gal staining positive cells (H, n = 7 to 8 for each group) and the percent of ki67 positive cells (I, n = 9 to 11 for each group) in HFF cells. (J) The total cumulative population doublings of HFF cells in standard conditions (DMSO) and in sapanisertib treatment are depicted. Each dot denotes a passage, and the dashed line indicates the cessation of cell expansion. (Scale bar, 100 μm.) Data are presented as mean ± SEM. Significance was determined by one-way ANOVA. **P < 0.01; ***P < 0.001; ****P < 0.0001. HFF, human foreskin fibroblasts; PCNA, proliferation cell nuclear antigen; P20, passage 20. |
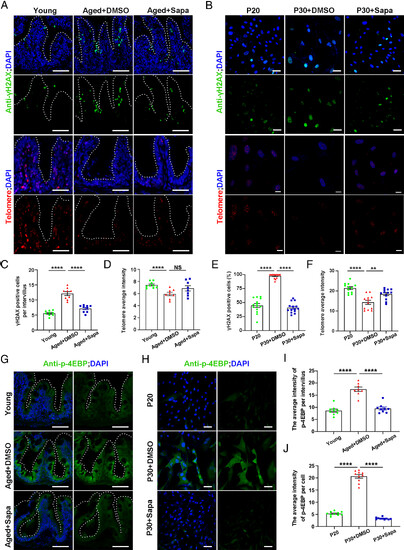
Sapanisertib attenuated DNA damage and maintained telomeres stability in both physiological-aging zebrafish and replicative-senescent HFF cells via mTORC1 inhibition. (A and B) Representative images of γH2AX staining (Top) and immunofluorescence section images of telomere staining (Bottom) in the intestine of young, aged+DMSO, and aged+Sapa groups (A) and HFF cells of P20, P30+DMSO, and P30+Sapa groups (B). (C–F) Quantification of the γH2AX -positive cells per intervillus in the intestine (C, n = 9 for each group) and in HFF cells (E, n = 14 for each group). Quantification of the intensity of the average fluorescence intensity in the intestine (D, n = 10 for each group) and HFF cells (F, n = 12 for each group). (G–J) Representative images of p-4EBP staining in the intestine (G) and HFF cells (H). Quantification of the intensity of p-4EBP per intervillus in the intestine (I, n = 8 to 9 for each group) and in HFF cells (J, n = 10 for each group). (Scale bar, 100 μm.) Data are presented as mean ± SEM. Significance was determined by one-way ANOVA. NS, not significant; **P < 0.01; ****P < 0.0001. HFF, human foreskin fibroblasts; P20, passage 20. |