FIGURE SUMMARY
Title

2-Acetamidophenol (2-AAP) Suppresses the Progression of Atherosclerosis by Alleviating Hyperlipidemia and Attenuating the Ferroptosis Pathway

Authors
Zang, X., Wang, Y., Han, C., Cui, L., Liu, H., Tian, S., Liu, K., Li, P., Sun, C., Xia, Q., Zhang, Y.
Source
Full text @ Mar. Drugs

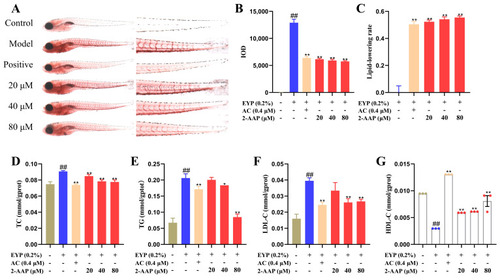
Effects of 2-AAP treatment on lipid metabolism in zebrafish after egg yolk powder feeding. (A) Typical images of zebrafish stained with Oil Red O. The whole fish was shown on the left, and the enlarged fish tails were shown on the right. (B) IOD values of Oil Red O staining in the tail, n = 10. (C) The lipid lowering rate of 2-AAP treatment, n = 10. Effects of 2-AAP treatment on TC (D), TG (E), LDL-C (F), and HDL-C (G) levels. In the column chart, brown represents the blank group, blue represents the model group, and red represents the administration group. Compared with the control group, ## p < 0.01. Compared with the model group, * p < 0.05, ** p < 0.01.

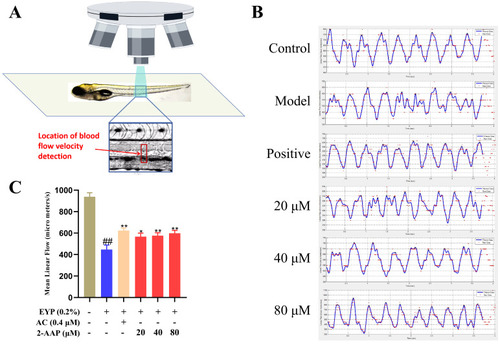
2-AAP improves blood flow velocity and stability. (A) Schematic diagram of the location of blood flow velocity detection. (B) Real-time detection of zebrafish blood flow velocity waveforms. (C) Mean blood flow velocity in the tail vessels of zebrafish, n = 7. In the column chart, brown represents the blank group, blue represents the model group, and red represents the administration group. Compared with the control group, ## p < 0.01. Compared with the model group, * p < 0.05, ** p < 0.01.

2-AAP improves vascular inflammation. (A) Phenotypic diagram of decreased macrophage density caused by 2-AAP. The whole fish was shown on the left, and the enlarged fish tails were shown on the right. (B) IOD values of immune cells that accumulated in the tail, n = 12. (C) Phenotypic diagram of alleviation of intravascular macrophage aggregation by 2-AAP. The red arrow indicates intravascular macrophages. In the column chart, brown represents the blank group, blue represents the model group, and red represents the administration group. Compared with the control group, ## p < 0.01. Compared with the model group, ** p < 0.01.

2-AAP improves oxidative stress. (A) Phenotypic diagram of reduced ROS fluorescence intensity caused by 2-AAP. The whole fish was shown on the left, and the enlarged fish tails were shown on the right. (B) IOD values of ROS accumulated in the tail, n = 16. Effects of 2-AAP treatment on T-SOD (C), MDA (D), CAT (E), and T-AOC (F) levels. In the column chart, brown represents the blank group, blue represents the model group, and red represents the administration group. Compared with the control group, # p < 0.05, ## p < 0.01. Compared with the model group, * p < 0.05, ** p < 0.01.

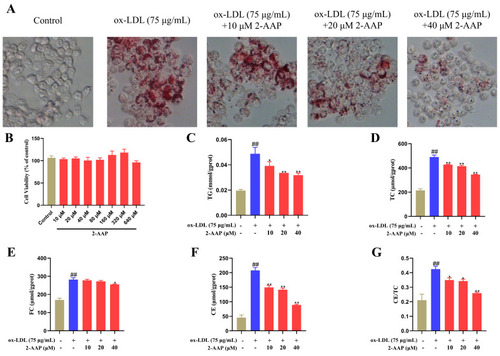
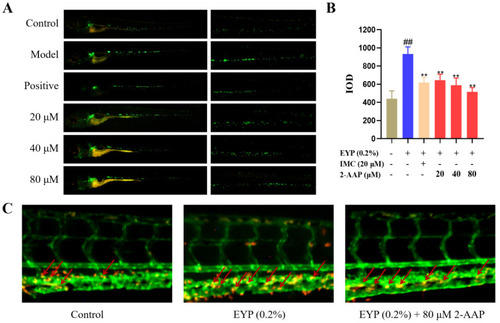
2-AAP reduces macrophage phagocytosis of oxidized lipids. (A) Oil Red O staining of macrophages. (B) Viability of RAW264.7 cells treated with 2-AAP. TG (C), TC (D), FC (E), CE (F), and CE/TC (G) contents in macrophages. In the column chart, brown represents the blank group, blue represents the model group, and red represents the administration group. Compared with the control group, ## p < 0.01. Compared with the model group, * p < 0.05, ** p < 0.01.

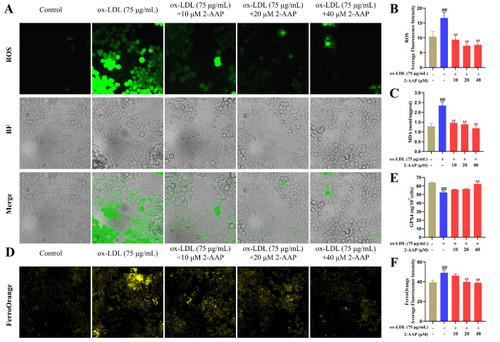
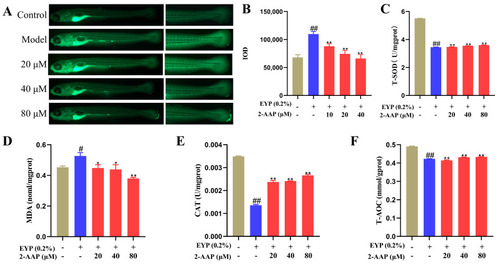
2-AAP improves oxidative stress and ferroptosis. (A) Typical diagram of ROS probe binding. (B) Statistics of the average fluorescence intensity of ROS. (C) MDA contents in the macrophages. (D) A typical FerroOrange diagram. (E) GPX4 vitality in macrophages. (F) Statistics of the average fluorescence intensity of FerroOrange. In the column chart, brown represents the blank group, blue represents the model group, and red represents the administration group. Compared with the control group, ## p < 0.01. Compared with the model group, ** p < 0.01.

Effects of 2-AAP on genes in zebrafish. (A) Venn diagram. (B) Differential expression gene statistics. (C) Volcano plots of 2-AAP-vs.-M. (D) Differential gene radar map of 2-AAP-vs.-M. The first circle from outside to inside represents upregulated genes (red) and downregulated genes (blue), and the size of the circle varies according to the ∣Log2FC∣ value. The data in the second outer circle represent the average expression of the 2-AAP group. Genes that were upregulated in expression after drug administration are shown as yellow spikes in the graph.

Enrichment analysis. (A) Top 30 GO terms in AAP-vs.-M. (B) GO analysis radar chart in AAP-vs.-M. The first circle represents the items of GO enrichment, and the outside of the circle represents a ruler with respect to gene number. Different colors represent different GO classifications. The second circle represents the number of genes enriched in the GO terms, and the color indicates the p value; the greater the number of genes, the longer the bar, and the smaller the p value, the redder the color. The third circle represents gene expression trends. (C) Top 20 pathways enriched in the AAP-vs.-M comparison. (D) KEGG analysis radar chart of the AAP-vs.-M comparison.

GSEA. (A) ES distribution map in ferroptosis. (B) ES distribution map of glutathione metabolism. (C) Differential gene-clustering heatmap for ferroptosis. (D) Differential gene-clustering heatmap of glutathione metabolism. The green line shows the distribution of ES for all genes. As depicted in the figure, when ES > 0, the gene on the left side of the dashed line is the core gene, which contributed significantly to the enriched pathways.

Expression of ferroptosis-, glutathione metabolism-, lipid metabolism-, inflammation-, and antioxidant-related genes following 2-AAP exposure. In the column chart, brown represents the blank group, blue represents the model group, and red represents the administration group. Compared with the control group, # p < 0.05, ## p < 0.01. Compared with the model group, * p < 0.05, ** p < 0.01.

Acknowledgments
This image is the copyrighted work of the attributed author or publisher, and ZFIN has permission only to display this image to its users. Additional permissions should be obtained from the applicable author or publisher of the image. Full text @ Mar. Drugs