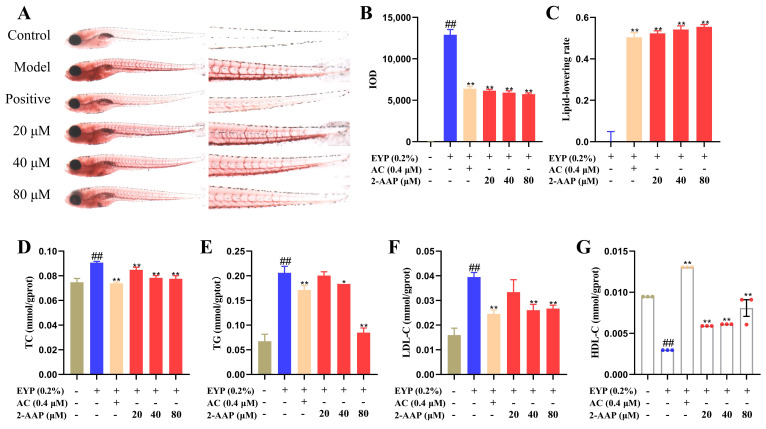
Effects of 2-AAP treatment on lipid metabolism in zebrafish after egg yolk powder feeding. (A) Typical images of zebrafish stained with Oil Red O. The whole fish was shown on the left, and the enlarged fish tails were shown on the right. (B) IOD values of Oil Red O staining in the tail, n = 10. (C) The lipid lowering rate of 2-AAP treatment, n = 10. Effects of 2-AAP treatment on TC (D), TG (E), LDL-C (F), and HDL-C (G) levels. In the column chart, brown represents the blank group, blue represents the model group, and red represents the administration group. Compared with the control group, ## p < 0.01. Compared with the model group, * p < 0.05, ** p < 0.01.
Acknowledgments
This image is the copyrighted work of the attributed author or publisher, and
ZFIN has permission only to display this image to its users.
Additional permissions should be obtained from the applicable author or publisher of the image.
Full text @ Mar. Drugs
Your Input Welcome
Thank you for submitting comments. Your input has been emailed to ZFIN curators who may contact you if
additional information is required.
Oops. Something went wrong. Please try again later.