FIGURE SUMMARY
Title

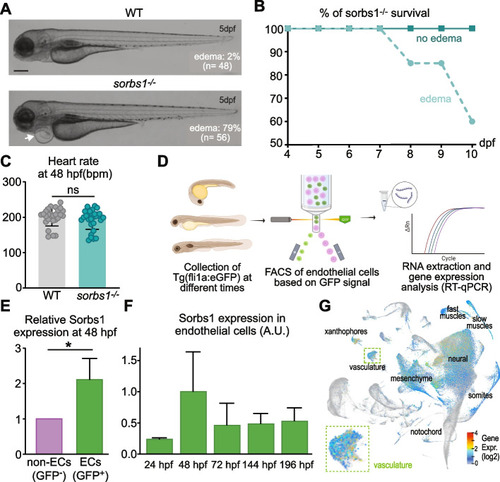
The cytoskeleton adaptor protein Sorbs1 controls the development of lymphatic and venous vessels in zebrafish

Authors
Veloso, A., Bleuart, A., Conrard, L., Orban, T., Bruyr, J., Cabochette, P., Germano, R.F.V., Schevenels, G., Bernard, A., Zindy, E., Demeyer, S., Vanhollebeke, B., Dequiedt, F., Martin, M.
Source
Full text @ BMC Biol.

Sorbs1 expression is enriched in the endothelium and its deletion in zebrafish results in cardiac edemas. A Transmitted light images of live wild-type (WT) and sorbs1 mutant (sorbs1−/−) zebrafish embryos at 5 days post-fertilization (dpf). The white arrow indicates an example of edema observed in sorbs1−/− embryo. Proportions of embryos with edemas in each genotype are indicated. Scale bar represents 250 μm. B Quantification of the percentage of survival for sorbs1−/− embryos presenting or not edemas from 4 to 10 dpf (n = 23 and n = 47, respectively). C Quantification of the heart rate in WT and sorbs1−/− embryos at 48 hpf (n = 45 and n = 49, respectively). D Illustration of the procedure used to sort endothelial cells by FACS (fluorescence-activated cell sorting) from Tg(fli1a:eGFP)y1 zebrafish embryos, at different stages of development, followed by RNA extraction and reverse transcription-qPCR (RT-qPCR). E, F RT-qPCR analysis of sorbs1 expression relative to Elfa after FACS sorting as described in D, in endothelial cells (ECs, GFP + , green bars) vs non-endothelial cells (non-ECs, GFP-, purple bar) (E) or in endothelial cells at different time points of embryonic development (F) (*P < 0.05, unpaired t-test). G UMAP of sorbs1 expression at single-cell level obtained from the Daniocell database consisting of whole-animal wild-type zebrafish across multiple stages of development (14–120 hpf). Cluster annotation was taken from the Daniocell resource

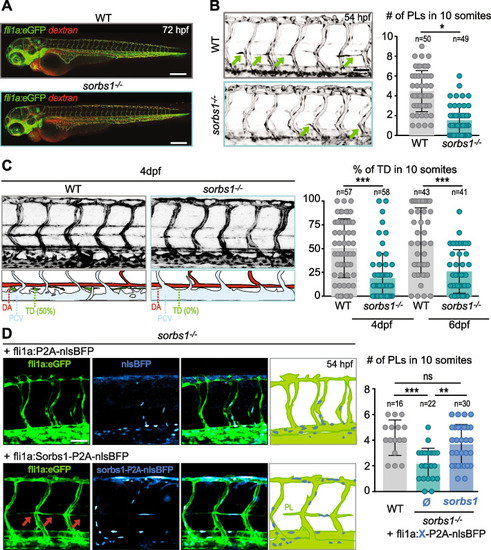
Sorbs1 is necessary for trunk lymphangiogenesis in vivo. A Confocal microscopy (Z-maximum intensity projections) of 72 hpf WT and sorbs1−/− Tg(fli1a:eGFP)y1 embryos vasculature (green) after injection of tetramethylrhodamine dextran (2,000,000 kDa, 25 μg/μl) in the circulation to assess vessel perfusion (red). Scale bar represents 250 μm. B Confocal microscopy (Z-maximum intensity projections) of the trunk vasculature of WT and sorbs1−/− Tg(fli1a:eGFP)y1 embryos at 54 hpf used to quantify the number of parachordal lymphangioblasts (PLs) (green arrows) over 10 somite segments. Scale bars represent 50 μm (n = number of embryos, respectively; *P < 0.05, Mann–Whitney U-test). C Z-maximum projections of confocal images of the trunk vasculature from 4 dpf Tg(fli1a:eGFP)y1 WT or sorbs1 knock-out embryos. Schematic representations of arterial (red), venous (light blue), and lymphatic (green) vessels are shown below. Dorsal aorta (DA), posterior cardinal vein (PCV), thoracic duct (TD). Scale bars represent 50 μm. Graph shows the quantification of the thoracic duct (TD) extent over 10 segments at 4 and 6 dpf in WT and sorbs1−/. embryos (n = number of embryos; ***P < 0.001; Mann–Whitney U-test). D Z-maximum projections of confocal images of the trunk vasculature of 54 hpf Tg(fli1a:eGFP)y1 sorbs1 knock-out embryos expressing transgenic endothelial constructs coding for human Sorbs1 or not were used to quantify the number of PLs in 10 somites. BFP is used as transgenesis marker. Scale bar represents 50 μm (n = number of embryos, ns = non-significant; ***P < 0.001; **P < 0.01; Mann–Whitney U-test)

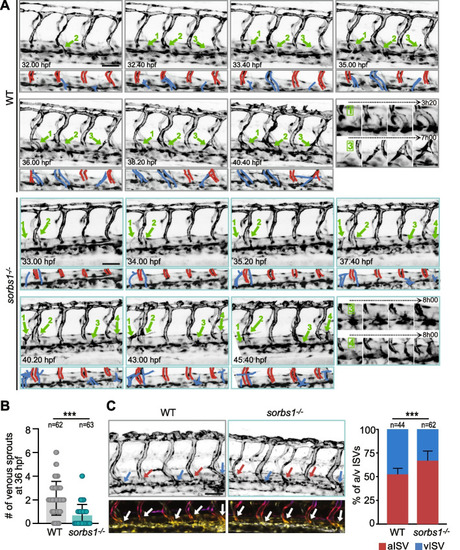
Secondary sprouting is impaired in the absence of sorbs1. A Frames (Z-maximum projections) from time-lapse confocal imaging of WT (gray boxes) and sorbs1−/− (light blue boxes) Tg(fli1a:eGFP)y1 embryos during venous secondary sprouting. Scale bar represents 50 μm. Numbered green arrows indicate sprouting events from the PCV, some of them being illustrated with zooms spanning the time indicated with the dashed arrows in the last boxes. B Quantification of secondary sprouts visible at 36 hpf in WT and sorbs1 mutants (sorbs1−/−) (n = number of embryos, ***P < 0.001; Mann–Whitney U-test). C Z-maximum projections of confocal images of the trunk vasculature of 48 hpf Tg(fli1a:eGFP)y1 WT and sorbs1 knock-out embryos. Blue and red arrows point to venous and arterial ISVs respectively and 3D color-coded stacks are shown at the bottom. Scale bar represents 50 μm. Graph shows the quantification of percentage of aISVs and vISVs at 48 hpf (n = number of embryos, *** P < 0.001; χ.2 with Yates correction)

Sorbs1 is expressed in the vasculature throughout development. A Z-maximum projections of confocal images of the trunk vasculature of WT embryos at the indicated time of development and stained for sorbs1 transcripts (magenta dots) and for vessels (gfp immunostaining, green) using FISH. The DA and PCV are delineated in red and blue. zx sections are shown on the right to show presence of signal inside the vessels. The enrichment of the FISH signals (cumulative area of the spots) in the DA and in the PCV compared to non-endothelial tissues was quantified for each time point (see the “Methods” section for details). Scale bar represents 75 μm. DA, dorsal aorta; PCV, posterior cardinal vein; ISV, intersegmental vessel; PLs, parachordal lymphangioblasts (n = 4 embryos (24 hpf); n = 5 embryos (32 hpf); n = 6 embryos (48 hpf); n = 5 embryos (72 hpf); ns = non-significant; ***P < 0.001; **P < 0.01; *P < 0.05; Mann–Whitney U-test for comparing the expression between the DA and the PCV and Kruskal–Wallis test for testing the endothelial enrichment). B Quantification of the expression of sorbs1 and two veinous/lymphatic markers, prox1a and lyve1b, in arterial and venous cell types across development from the single-cell sequencing Daniocell database. The color gradient, ranging from light to darker violet, represents the mean gene expression level in cells. The size of each dot corresponds to the percentage of cells expressing the target gene within the cluster

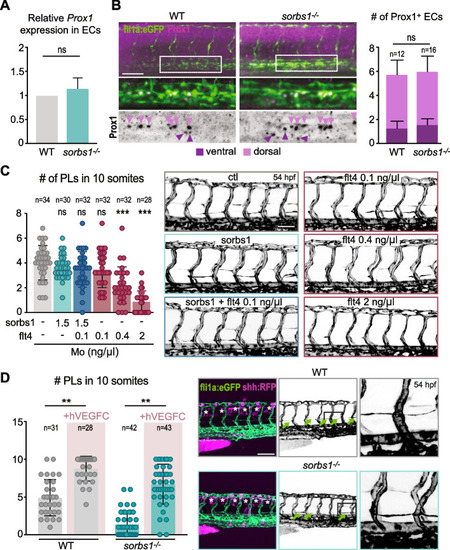
Sorbs1 functions independently of Vegfc signaling during in vivo lymphangiogenesis. A RT-qPCR analysis of prox1a relative expression at 48 hpf in endothelial cells (ECs) sorted from WT and sorbs1−/− Tg(fli1a:eGFP)y1 embryos using FACS as described in Fig. 1D (ns = non-significant, unpaired t-test). Results are means from 5 experiments. B Confocal imaging (Z-maximum intensity projections) of WT or sorbs1−/− Tg(fli1a:eGFP)y1 embryos after immuno-staining against Prox1 was used to quantify the number of Prox1-positive endothelial cells per 2 body segments in the dorsal (light purple arrows) and ventral side (dark purple arrows) of the posterior cardinal vein at 32 hpf. Scale bar represents 50 μm (n = number of embryos; ns = non-significant; two-tailed Mann–Whitney U-test). C Quantification of PLs in 10 somites of Tg(kdrl:GFP) embryos injected with sorbs1 and/or flt4 morpholino, at different concentrations (indicated in the figure) (n = number of embryos; ns = non-significant, ***P < 0.001; Mann–Whitney U-test). Representative confocal microscopy images (Z-maximum intensity projections) of the trunk vasculature are shown on the right. Scale bar represents 75 μm. D Confocal images (Z-maximum intensity projections) were used to quantify PL extent within the trunk region of 54 hpf Tg(fli1a:eGFP)y1 WT or sorbs1/ embryos expressing transgenic constructs coding for human VEGFC fused with RFP, or the RFP alone, under the shh promoter (expression in the roof plate, white asterisks) (n = number of embryos; **P < 0.01; Mann–Whitney U-test). PLs are indicated with green arrows and magnified insets on the right provide detailed views of PL morphology. Scale bar represents 100 μm

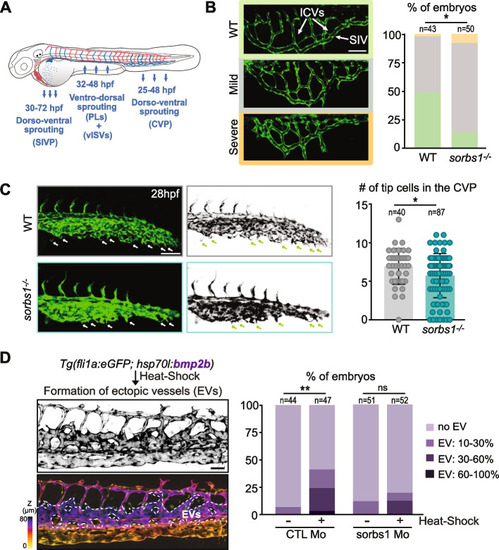
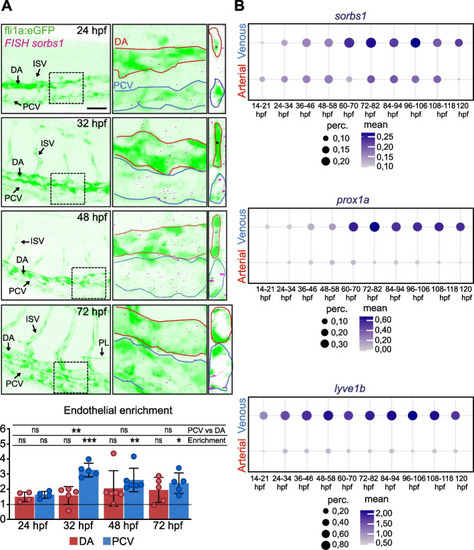
Sorbs1 depletion results in defects in ventral sprouting from the PCV. A Schematic representation of arterial (red) and venous (blue) vascular network in the zebrafish embryo. Blue arrows indicate the direction of endothelial cell migration during the formation of PCV-derived angiogenic structures at specific developmental time points. SIVP, subintestinal venous plexus; PLs, parachordal lymphangioblasts; vISVs, venous Intersegmental vessels; CVP, caudal vein plexus. B Confocal pictures of the subintestinal plexus of three different phenotypes encountered in WT and sorbs1−/− Tg(fli1a:eGFP)y1 embryos at 80 hpf and quantification of the distribution of these phenotypes coded according to the color of the box in the two genotypes (n = number of embryos, *P < 0.05; two-tailed Mann–Whitney U-test). Scale bars represent 50 μm. ICVs, interconnecting vessels; SIV, subintestinal vein. C Confocal imaging (Z-maximum intensity projection) of CVP tip cells (white arrows) from 28 hpf wild-type and sorbs1−/− embryos used to quantify tip cell numbers (n = number of embryos; *P < 0.05; two-tailed Mann–Whitney U-test). Scale bars represent 100 μm. D Z-maximum projections, color-coded or not, of confocal images of the trunk regions of 54 hpf Tg(fli1a:eGFP; hsp70l:bmp2b) embryos that were heat-shocked at 26 hpf used to illustrate formation of ectopic vessels (EVs, indicated with dotted lines). Scale bars represent 50 μm. Quantification of EVs growing from the PCV at 28 hpf in Tg(fli1a:eGFP;hsp70l:bmp2b) embryos injected with Ctl or sorbs1 Mo without ( −) or after ( +) a heat-shock treatment at 26 hpf (n = number of embryos, **P < 0.01, ns = non-significant, χ.2 pairwise proportion test with Holm correction)

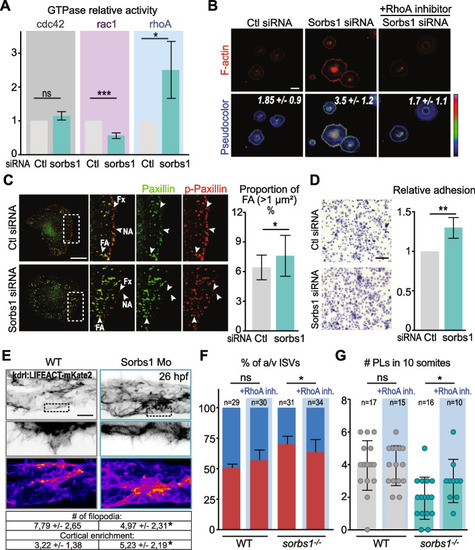
Sorbs1 controls EC adhesive properties via RhoGTPases in vitro and in vivo. A Cdc42, Rac1, and RhoA activity in HUVECs transfected with control (Ctl) or Sorbs1 siRNA. Histogram is from Western blot densitometric analysis of three independent pull-down experiments and represents the ratio between bound active- and total amount of each RhoGTPase in the lysate, relative to control cells (***P < 0.001, *P < 0.05, ns = non-significant, Student’s t-test). B Confocal pictures of peripheral F-Actin (phalloidin staining) in Ctl or Sorbs1 siRNA transfected HUVECS treated ( +) or not ( −) with the C3 RhoA inhibitor. Images are shown using an intensity-based look-up table (from blue = low to red = high). Numbers represent the average signal intensity ± SD in each condition. Scale bar represents 50 μM. C Adhesion complexes were analyzed by confocal microscopy after immunostaining of Paxillin and phospho-Paxillin (p-Paxilin) in HUVECs transfected with control or Sorbs1 siRNA. Scale bar represents 20 μm. Nascent adhesions (NA) and focal complexes (Fx) are characterized by their small size, peripheral location and high p-Paxillin/Paxillin ratio content (arrowheads). Larger and more mature focal adhesion (FA) were defined as bigger than 1 μm2, and their proportion in each condition was quantified (n = 21; *P < 0.05, Student’s t-test). D Representative micrographs and quantification of adhesion assays performed with HUVECs transfected with control or Sorbs1 siRNA as described in the “Methods” section. Scale bars represent 100 μm (n = 3 independent experiments; **P < 0.01, Student’s t-test). E Representative live confocal images (Z-maximum intensity projection) of emerging filopodia in the CVP of 26 hpf Tg(LIFEACT:mKate2) embryos injected with Ctl or Sorbs1 morpholino at 5 ng/ul. Enrichment of actin at the cell cortex from the boxed area is visualized using a color look-up table (intensity scale). The number of filopodia per 40 μm and the cortical enrichment of the F-actin signal is indicated for both conditions in the table. Scale bar represents 40 μm (n = 7/WT and n = 9/Sorb1 Mo, *P < 0.05, Mann–Whitney U-test). F WT and sorbs1−/− embryos were treated or not with RhoA inhibitor at 26 hpf, and the percentage of aISV/vISV at 48 hpf was quantified (n = number of embryos; * P < 0.05; ns = non-significant; χ2 with Yates correction). G Quantification of PL number in 10 somites at 54 hpf in WT and sorbs1−/. embryos injected with RhoA inhibitor at 26 hpf or left untreated (n = number of embryos; *P < 0.05; ns = non-significant; Mann–Whitney U-test)

Acknowledgments
This image is the copyrighted work of the attributed author or publisher, and ZFIN has permission only to display this image to its users. Additional permissions should be obtained from the applicable author or publisher of the image. Full text @ BMC Biol.