IMAGE

Fig. 2

ID
ZDB-IMAGE-240229-173
Source
Figures for Veloso et al., 2024
Image
Figure Caption

Fig. 2

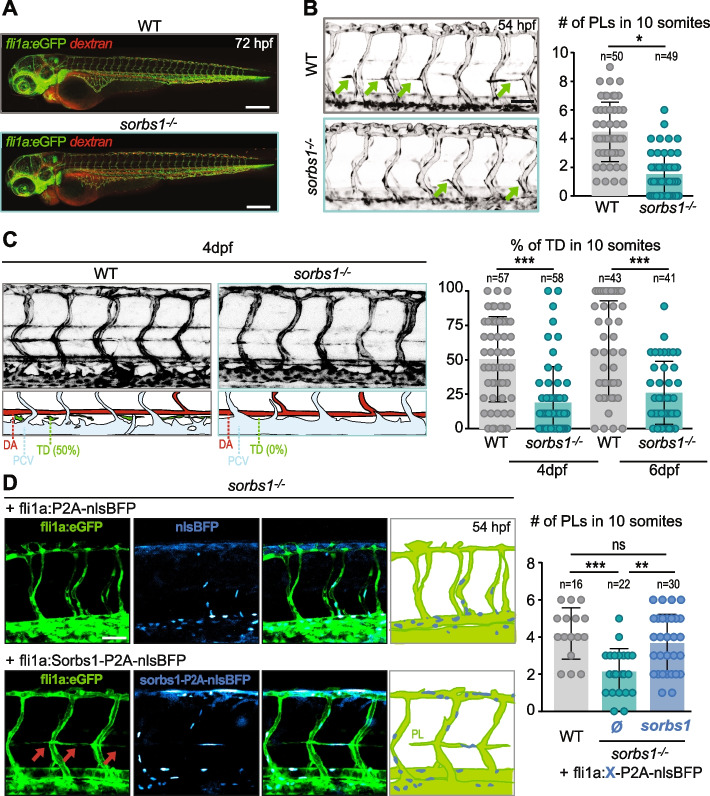
Sorbs1 is necessary for trunk lymphangiogenesis in vivo. A Confocal microscopy (Z-maximum intensity projections) of 72 hpf WT and sorbs1−/− Tg(fli1a:eGFP)y1 embryos vasculature (green) after injection of tetramethylrhodamine dextran (2,000,000 kDa, 25 μg/μl) in the circulation to assess vessel perfusion (red). Scale bar represents 250 μm. B Confocal microscopy (Z-maximum intensity projections) of the trunk vasculature of WT and sorbs1−/− Tg(fli1a:eGFP)y1 embryos at 54 hpf used to quantify the number of parachordal lymphangioblasts (PLs) (green arrows) over 10 somite segments. Scale bars represent 50 μm (n = number of embryos, respectively; *P < 0.05, Mann–Whitney U-test). C Z-maximum projections of confocal images of the trunk vasculature from 4 dpf Tg(fli1a:eGFP)y1 WT or sorbs1 knock-out embryos. Schematic representations of arterial (red), venous (light blue), and lymphatic (green) vessels are shown below. Dorsal aorta (DA), posterior cardinal vein (PCV), thoracic duct (TD). Scale bars represent 50 μm. Graph shows the quantification of the thoracic duct (TD) extent over 10 segments at 4 and 6 dpf in WT and sorbs1−/. embryos (n = number of embryos; ***P < 0.001; Mann–Whitney U-test). D Z-maximum projections of confocal images of the trunk vasculature of 54 hpf Tg(fli1a:eGFP)y1 sorbs1 knock-out embryos expressing transgenic endothelial constructs coding for human Sorbs1 or not were used to quantify the number of PLs in 10 somites. BFP is used as transgenesis marker. Scale bar represents 50 μm (n = number of embryos, ns = non-significant; ***P < 0.001; **P < 0.01; Mann–Whitney U-test)

Acknowledgments
This image is the copyrighted work of the attributed author or publisher, and ZFIN has permission only to display this image to its users. Additional permissions should be obtained from the applicable author or publisher of the image. Full text @ BMC Biol.