
- Title
-
Differential allelic representation (DAR) identifies candidate eQTLs and improves transcriptome analysis
- Authors
- Baer, L., Barthelson, K., Postlethwait, J.H., Adelson, D.L., Pederson, S.M., Lardelli, M.
- Source
- Full text @ PLoS Comput. Biol.
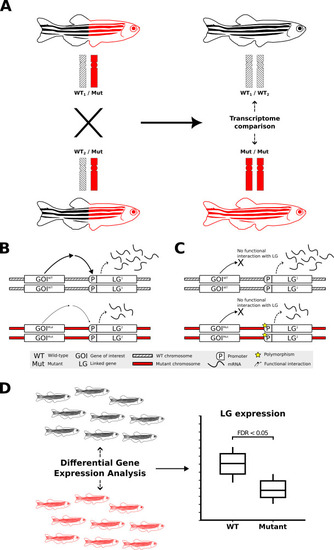
Transcriptome analysis of homozygous mutants compared to their wild-type siblings and the impact of non-isogenic genetic backgrounds on gene expression. |
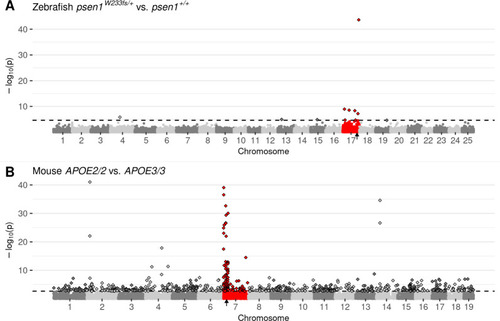
Manhattan plots highlighting CC-DEGs from differential expression testing in: |
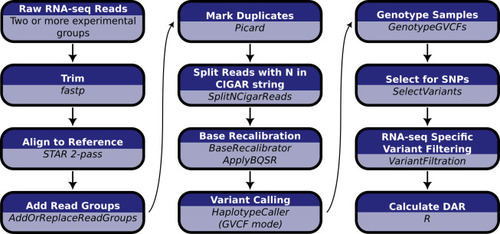
Computational workflow for the calculation of DAR starting with raw RNA-seq short read data. Raw RNA-seq reads must consist of at least two experimental groupings to allow the calculation of DAR between them. |
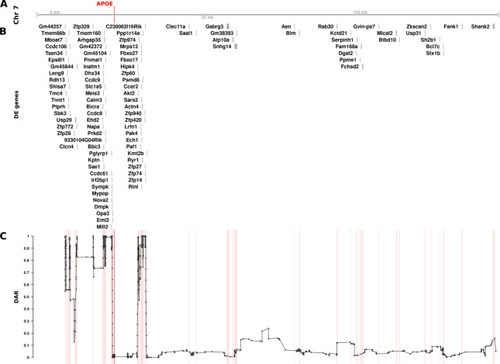
The relationship between DE genes and DAR along the entirety of mouse Chromosome 7 between male The plot contains four sets of information represented by separate tracks horizontally. Track A represents the axis of Chromosome 7. The position of the |
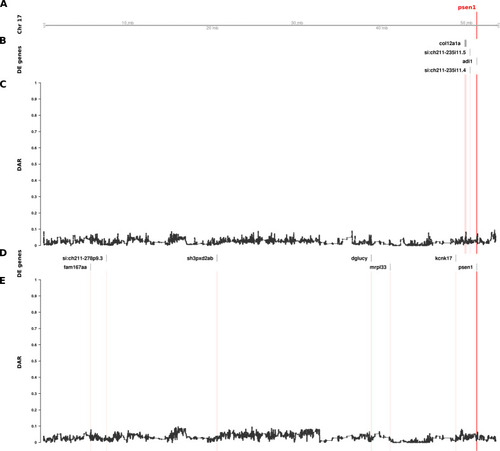
The relationship between DE genes and DAR along the entirety of zebrafish Chromosome 17 in brain transcriptome comparisons of 6-month-old wild type fish against sibling fish heterozygous for either of two different Track A represents the axis of Chromosome 17. The position of |
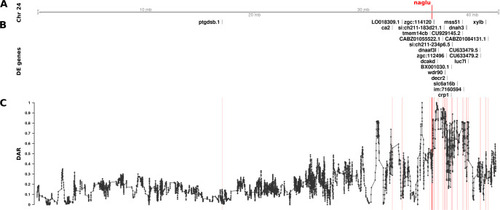
The relationship between DE genes and DAR along Chromosome 24 between Track A represents the axis of Chromosome 24. The position of |
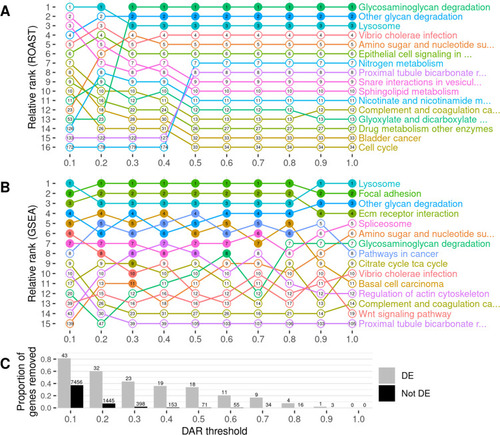
The impact of gene exclusion by DAR thresholding on the outcomes of functional enrichment analysis using KEGG gene sets. Panel |
Comparison of GSEA results for KEGG gene sets that achieved significance before and/or after use of DAR to weight the gene-level ranking statistic in the |
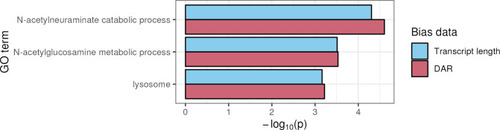
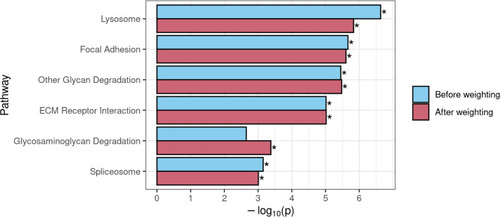
Comparison of over-representation analysis results for GO terms that achieved significance when using either transcript length or DAR as bias data for All three displayed GO terms showed statistical significance when transcript length or DAR was used as bias data. However, DAR showed greater significance for all terms. |