
Image
|
Figure Caption
Fig 9
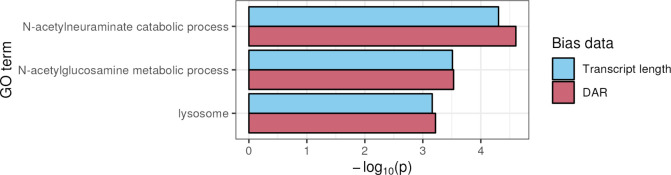
Comparison of over-representation analysis results for GO terms that achieved significance when using either transcript length or DAR as bias data for
All three displayed GO terms showed statistical significance when transcript length or DAR was used as bias data. However, DAR showed greater significance for all terms.
Acknowledgments
This image is the copyrighted work of the attributed author or publisher, and
ZFIN has permission only to display this image to its users.
Additional permissions should be obtained from the applicable author or publisher of the image.
Full text @ PLoS Comput. Biol.