
- Title
-
Effects of 4 Testing Arena Sizes and 11 Types of Embryo Media on Sensorimotor Behaviors in Wild-Type and chd7 Mutant Zebrafish Larvae
- Authors
- Hodorovich, D.R., Fryer Harris, T., Burton, D.F., Neese, K.M., Bieler, R.A., Chudasama, V., Marsden, K.C.
- Source
- Full text @ Zebrafish
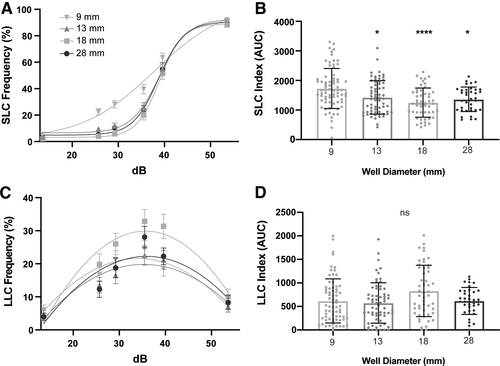
Testing arena size affects SLCs. (A) Acoustic startle responses, average SLC frequency comparing testing arena sizes (9 mm: n = 72; 13 mm: n = 64; 18 mm: n = 51; 28 mm: n = 36) (mean ± SEM). (B) SLC sensitivity index, calculated by the area under the SLC frequency curve for individual larvae (mean ± SD). (C) Average LLC frequency comparing testing arena sizes (mean ± SEM). (D) LLC sensitivity index, calculated by the area under the LLC frequency curve. Asterisks represent statistical significance for arena sizes compared to 9 mm arena (mean ± SD, Wilcoxon/Kruskal–Wallis tests with Wilcoxon each pair for nonparametric multiple comparisons, *p < 0.05, ****p < 0.0001). SLC, short-latency c-bend; LLC, long-latency c-bend; ns, not significantly different. |
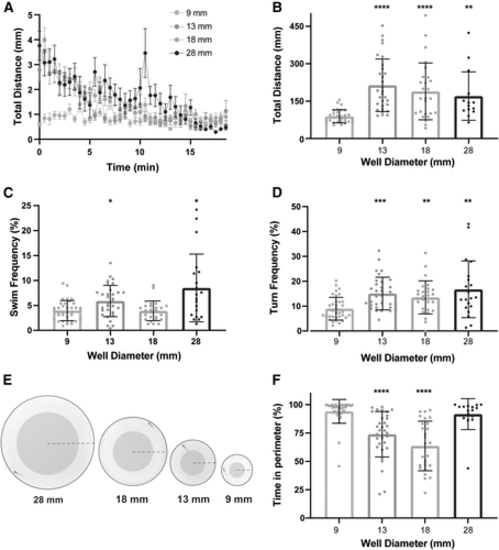
Arena size influences general locomotor activity and thigmotaxis behavior. (A) Total distance time plot during 18.5 min of recording comparing testing arena sizes (9 mm: n = 30; 13 mm: n = 30; 18 mm: n = 26; 28 mm: n = 20) (mean ± SEM). (B) Sum of distance traveled for individual larvae, and (C) swim and (D) turn frequencies (mean ± SD). (E) Images of each testing arena, with the shaded area indicating the center and the non-shaded area indicating the perimeter of the arena. The dashed line indicates the arena radius. (F) Percent of time spent in the perimeter during the 18.5 min testing period. Asterisks represent statistical significance for arena sizes compared to 9 mm arena (mean ± SD, Wilcoxon/Kruskal–Wallis tests with Wilcoxon Each Pair for nonparametric multiple comparisons, *p < 0.05, **p < 0.01, ***p < 0.001, ****p < 0.0001). |
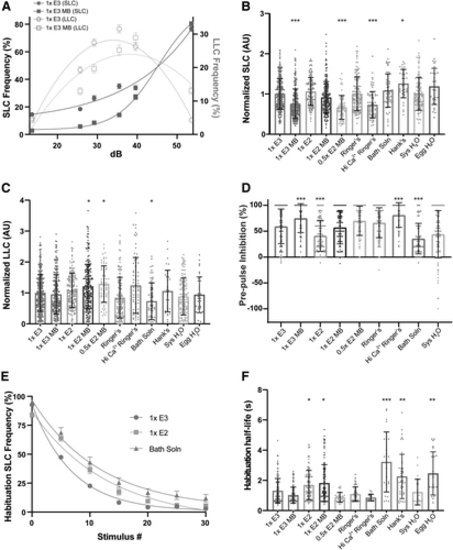
Embryo medium type impacts auditory-driven behaviors. (A) Acoustic startle responses, average SLC frequency (left y-axis), and LLC frequency (right y-axis) as acoustic stimulus intensity increases in 1 × E3 or 1 × E3 with methylene blue-treated larvae (mean ± SEM). (B) Normalized SLCs and (C) LLCs (AU), calculated by the area under the SLC or LLC frequency curves, respectively, for individual larvae, normalized to 1 × E3 (1 × E3: n = 397; 1 × E3 MB: n = 245; 1 × E2: n = 166; 1 × E2 MB: n = 231; 0.5 × E2 MB: n = 64; Ringer's: n = 141; Hi Ca2+ Ringer's: n = 79; Bath Solution: n = 61; Hank's: n = 36; Sys H2O: n = 123; Egg H2O: n = 36) (mean ± SD). (D) Rate of prepulse inhibition (1 × E3: n = 263; 1 × E3 MB: n = 118; 1 × E2: n = 108; 1 × E2 MB: n = 137; 0.5 × E2 MB: n = 63; Ringer's: n = 115; Hi Ca2+ Ringer's: n = 62; Bath Solution: n = 61; Sys H2O: n = 123) (mean ± SD). (E) Short-term habituation, average SLC frequency during 30 acoustic stimuli at highest intensity in 1 × E3-, 1 × E2-, and Bath Solution-treated larvae (mean ± SEM). (F) SLC half-life calculated by nonlinear regression (one-phase exponential decay) of SLC frequency curves for individual larvae. Asterisks represent statistical significance for medium type compared to 1 × E3 (mean ± SD, Wilcoxon/Kruskal–Wallis tests with Wilcoxon Each Pair for nonparametric multiple comparisons, *p < 0.01, **p < 0.001, ***p < 0.0001). AU, arbitrary unit. |
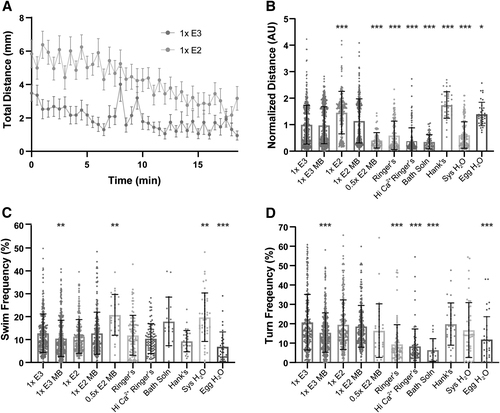
Medium type induces hypoactivity and hyperactivity in general locomotor behaviors. (A) Total distance time plot during 18.5 min of recording in 1 × E3- and 1 × E2-treated larvae (mean ± SEM). (B) Sum of distance traveled for individual larvae, normalized to 1 × E3 (1 × E3: n = 398; 1 × E3 MB: n = 382; 1 × E2: n = 193; 1 × E2 MB: n = 265; 0.5 × E2 MB: n = 72; Ringer's: n = 154; Hi Ca2+ Ringer's: n = 140; Bath Solution: n = 69; Hank's: n = 36; Sys H2O: n = 141; Egg H2O: n = 36). (C) Swim and (D) turn frequencies. Asterisks represent statistical significance for medium type compared to 1 × E3 (mean ± SD, Wilcoxon/Kruskal–Wallis tests with Wilcoxon Each Pair for nonparametric multiple comparisons, *p < 0.01, **p < 0.001, ***p < 0.0001). |
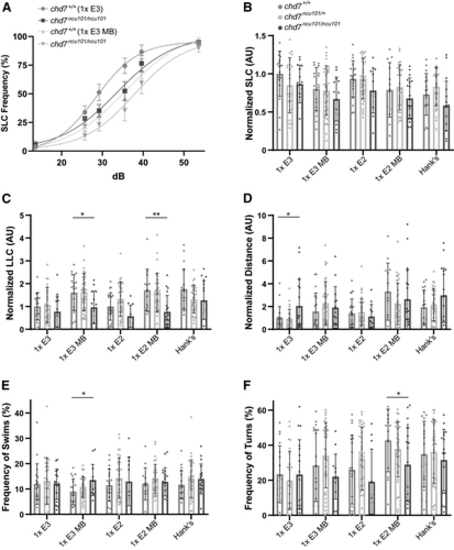
Medium type impacts behavioral phenotype penetrance in chd7 mutants. (A) Acoustic startle responses, average SLC frequency of chd7+/+ and chd7ncu101/ncu101 treated in 1 × E3 (chd7+/+ n = 18, chd7ncu101/ncu101 n = 15) or 1 × E3 with methylene blue (chd7+/+ n = 18, chd7ncu101/ncu101 n = 14) (mean ± SEM). (B) Normalized SLCs and (C) LLCs (AU), calculated by the area under the SLC or LLC frequency curves, respectively, for individual larvae, normalized to chd7+/+ [1 × E3]. Asterisks represent statistical significance for chd7ncu101/+, ncu101/ncu101 compared to wild-type siblings within medium type (1 × E3: chd7+/+ n = 18, chd7ncu101/+ n = 25, chd7ncu101/ncu101 n = 15; 1 × E3 MB: chd7+/+ n = 18, chd7ncu101/+ n = 38, chd7ncu101/ncu101 n = 14; 1 × E2: chd7+/+ n = 20, chd7ncu101/+ n = 36, chd7ncu101/ncu101 n = 11; 1 × E2 MB: chd7+/+ n = 13, chd7ncu101/+ n = 33, chd7ncu101/ncu101 n = 18; Hank's: chd7+/+ n = 18, chd7ncu101/+ n = 33, chd7ncu101/ncu101 n = 17). (D) Spontaneous locomotion, sum of total distance traveled, normalized to chd7+/+ [1 × E3], (E) swim and (F) turn frequencies for individual larvae. Asterisks represent statistical significance for chd7ncu101/+, ncu101/ncu101 compared to wild-type siblings within medium type (1 × E3: chd7+/+ n = 18, chd7ncu101/+ n = 26, chd7ncu101/ncu101 n = 17; 1 × E3 MB: chd7+/+ n = 18, chd7ncu101/+ n = 38, chd7ncu101/ncu101 n = 14; 1 × E2: chd7+/+ n = 21, chd7ncu101/+ n = 38, chd7ncu101/ncu101 n = 11; 1 × E2 MB: chd7+/+ n = 13, chd7ncu101/+ n = 26, chd7ncu101/ncu101 n = 20; Hank's: chd7+/+ n = 18, chd7ncu101/+ n = 33, chd7ncu101/ncu101 n = 18) (mean ± SD, One-way ANOVA with Student's t each pair test for multiple comparisons, *p < 0.05, **p < 0.01). |