FIGURE SUMMARY
Title

The ion channel Trpc6a regulates the cardiomyocyte regenerative response to mechanical stretch

Authors
Rolland, L., Abaroa, J.M., Faucherre, A., Drouard, A., Jopling, C.
Source
Full text @ Front Cardiovasc Med

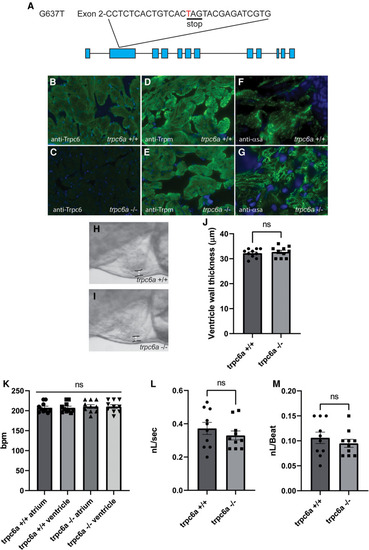
Loss of Trpc6a does not affect cardiac development. (A) Diagram of the point mutation carried by the sa23930 zebrafish transgenic line. The G637T mutation causes a premature stop codon in the Exon 2 of the trpc6a. (B,C) IHC images from adult heart sections showing the presence of Trpc6 in the myocardium of trpc6a+/+ but absent from the myocardium of trpc6a−/− zebrafish. Trpc6: green, DAPI: blue. (D,E) IHC images from adult heart sections showing the organization of tropomyosin (Trpm) in myocardium of trpc6a+/+ and in trpc6a−/− zebrafish. Trpm: green, DAPI: blue. (F,G). IHC images from adult heart sections showing the organization of α-sarcomeric actin (α-sa) in the myocardium of trpc6a+/+ and in trpc6a−/− zebrafish. α-sa: green, DAPI: blue. (H,I) Representative morphology of the ventricular wall of 5dpf larvae from control (trpc6a+/+, H) and trpc6a KO (trpc6a−/−,I) groups. (J) Ventricular wall thickness measurements of 5dpf larvae during diastole. T-test was used for statistical analysis. (K) Atrial and ventricular contraction rates (in bpm) of trpc6a+/+ and trpc6a−/− 5dpf larvae. 1-way ANOVA was used for statistical analysis. (L) Blood flow velocity (in nL/s) measured in the caudal vein at 5dpf. T-test was used for statistical analysis. (M) Cardiac output (in nL/beat) of trpc6a+/+ and trpc6a−/− 3dpf larvae. t-test was used for statistical analysis. (H–M) Data obtained on n = 10 larvae per group.

Trpc6a is required for cardiac regeneration. (A-C) AFOG staining images and quantification of the scar area at 30dpa. Representative image of AFOG staining obtained for trpc6a+/+ (A) and trpc6a−/− (B) Scale bars: 200 μm. The dashed line outlines the scar region. (C) Histogram depicting the quantification of the scar area (n=5/group). Students t-test was used for statistical analysis. **: p value < 0.01. (D–G) Representative images of alkaline phosphatase staining showing the vasculature of 7dpa whole mount hearts. Low (D,E) and high (F,G) magnification of the vascular plexus present in the wound region of trpc6a+/+ (D,F) and trpc6a−/− (E,G) zebrafish hearts. Scale bars: 200 μm. (H–J) Cardiomyocyte proliferation measured at 14dpa. Representative IHC images showing Mef2c (green), EdU (red) and DAPI (blue) for trpc6a+/+ (H) and trpc6a−/− (I). The white box depicts a higher magnification image in the upper right corner. Scale bars: 100 μm. (J). Quantification of EdU+ cardiomyocytes (n=3/group). Students t-test was used for statistical analysis. ***: p value < 0.001.

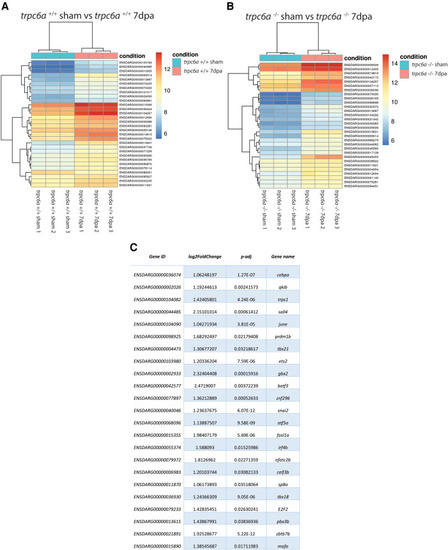
Loss of Trpc6a results in misregulated gene expression during regeneration. (A,B) Heatmaps showing the 30 top differentially regulated genes between sham and 7dpa hearts of trpc6a+/+ (A) and trpc6a−/− (B) zebrafish (C) Table of transcription factors which are significantly upregulated in trpc6a+/+ hearts but not in trpc6a−/− hearts following injury (compared to their respective sham controls).

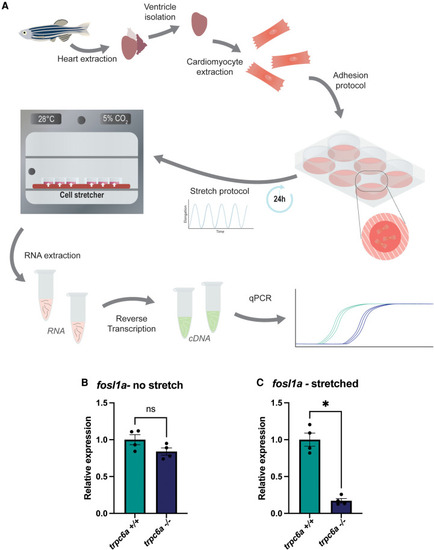
Trpc6a regulates the stretch induced expression of AP1 transcription factor components. (A) Schematic representation of the experimental design. Cardiomyocytes were isolated from extracted hearts and plated onto poly lysine-coated plates. A cyclic stretch protocol was applied for 24 h before RNA extraction and RT-qPCR. (B) Relative expression of fosl1a in unstretched trpc6a+/+ and trpc6a−/− cardiomyocytes. (C) Relative expression of fosl1a in trpc6a+/+ and trpc6a−/− cardiomyocytes subjected to cyclic stretch. Mann–Whitney test was used for statistical analysis. *: p value < 0.05.

Acknowledgments
This image is the copyrighted work of the attributed author or publisher, and ZFIN has permission only to display this image to its users. Additional permissions should be obtained from the applicable author or publisher of the image. Full text @ Front Cardiovasc Med