
- Title
-
amer1 Regulates Zebrafish Craniofacial Development by Interacting with the Wnt/β-Catenin Pathway
- Authors
- Sun, L., Ping, L., Fan, X., Fan, Y., Zhang, B., Chen, X.
- Source
- Full text @ Int. J. Mol. Sci.
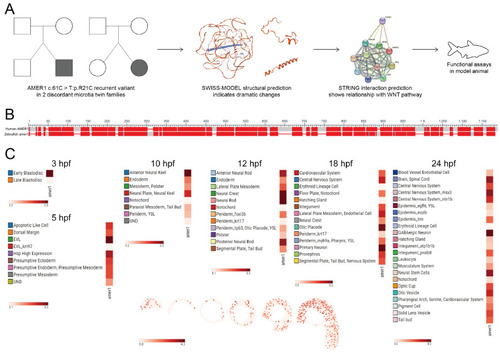
Identification of |
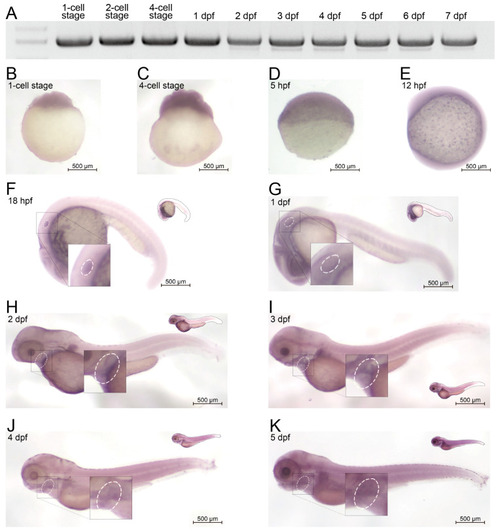
Expression of |
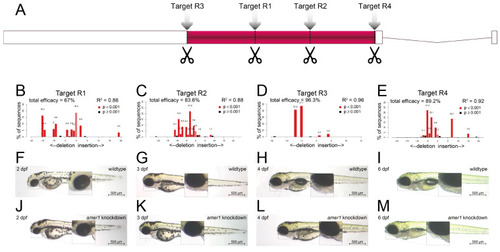
Knockdown of |
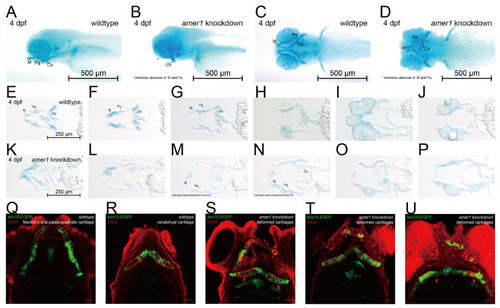
Phenotypic changes induced by |
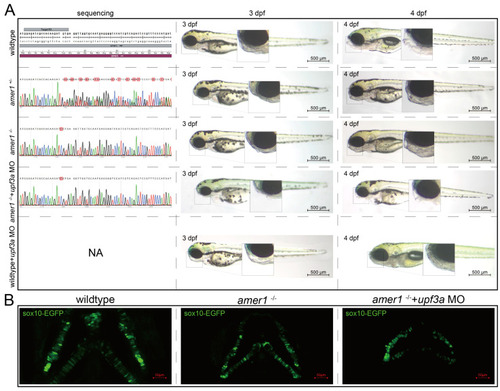
Genotypes and phenotypes of F2 zebrafish. ( EXPRESSION / LABELING:
PHENOTYPE:
|
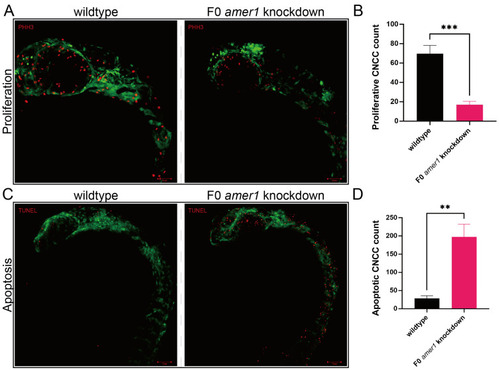
Proliferation and apoptosis of CNCCs in zebrafish embryos. ( |
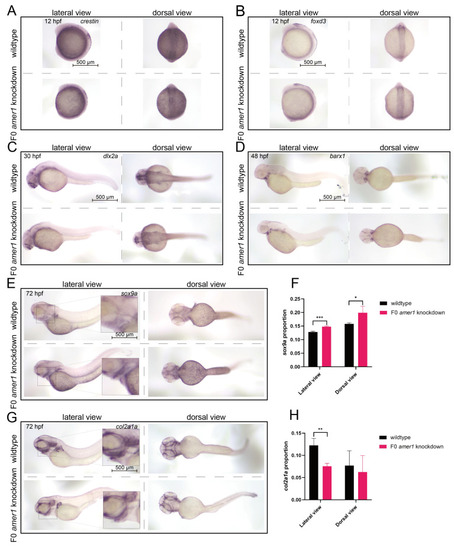
Expression of CNCC related markers in zebrafish embryos. In situ hybridization, showing the expression of ( EXPRESSION / LABELING:
PHENOTYPE:
|
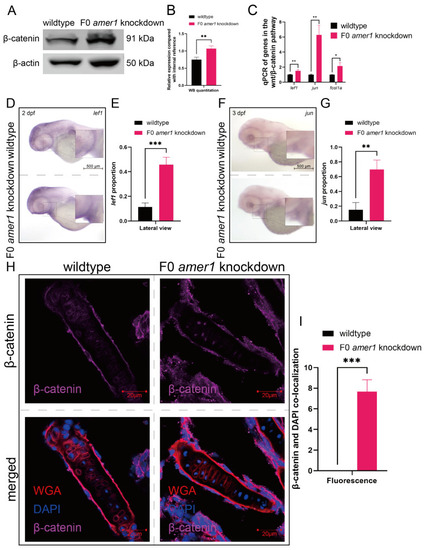
Expression and localization of components of the wnt pathway in zebrafish embryos. ( |
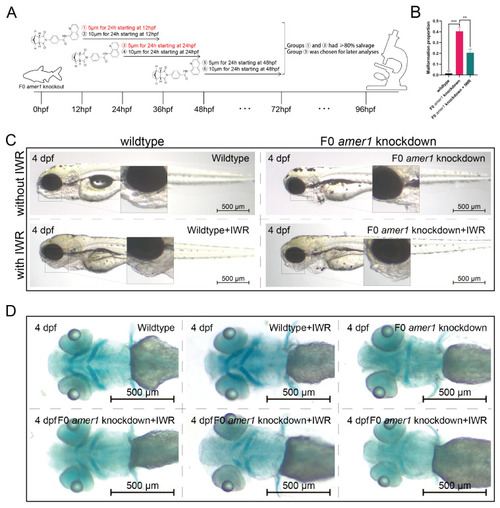
Phenotypic rescue of F0 PHENOTYPE:
|
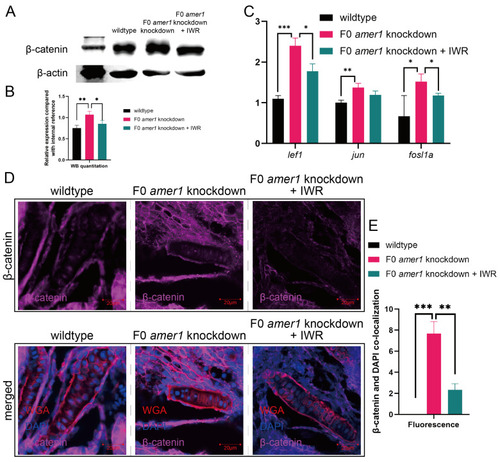
Effects of IWR-1-endo on components of the Wnt pathway in F0 |