IMAGE

Figure 5

ID
ZDB-IMAGE-240129-193
Source
Figures for Sun et al., 2024
Image
Figure Caption

Figure 5

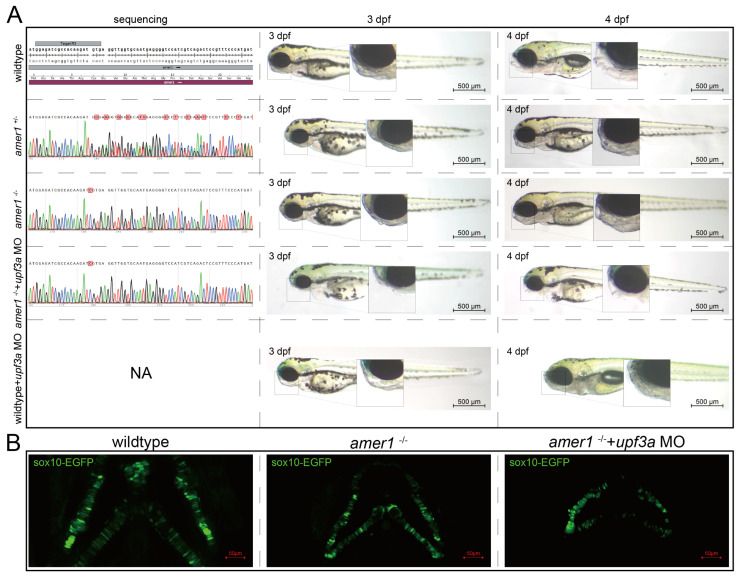
Genotypes and phenotypes of F2 zebrafish. (A) Sequencing results and brightfield images of F2 zebrafishes at 3 and 4 dpf with five different genotypes/treatments: wildtype, amer1+/−, amer1−/−, and amer1−/− + upf3a MO, wildtype + upf3a MO. amer1−/− F2 embryos treated with upf3a MO showed malformation of the mandible. Red suqares indicate mutated sites. NA: not applicable. (B) Fluorescence staining showing that chondrocytes were regularly distributed in wildtype and amer1−/− F2 embryos, but were disarranged in amer1−/− F2 embryos treated with upf3a MO.

Acknowledgments
This image is the copyrighted work of the attributed author or publisher, and ZFIN has permission only to display this image to its users. Additional permissions should be obtained from the applicable author or publisher of the image. Full text @ Int. J. Mol. Sci.