
- Title
-
Nomo1 deficiency causes autism-like behavior in zebrafish
- Authors
- Zhang, Q., Li, F., Li, T., Lin, J., Jian, J., Zhang, Y., Chen, X., Liu, T., Gou, S., Zhang, Y., Liu, X., Ji, Y., Wang, X., Li, Q.
- Source
- Full text @ EMBO Rep.

ZFIN is incorporating published figure images and captions as part of an ongoing project. Figures from some publications have not yet been curated, or are not available for display because of copyright restrictions. |
|
ZFIN is incorporating published figure images and captions as part of an ongoing project. Figures from some publications have not yet been curated, or are not available for display because of copyright restrictions. |
|
ZFIN is incorporating published figure images and captions as part of an ongoing project. Figures from some publications have not yet been curated, or are not available for display because of copyright restrictions. PHENOTYPE:
|
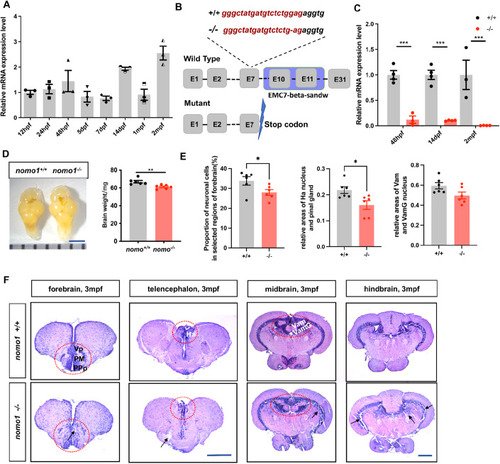
The expression level of the ( EXPRESSION / LABELING:
|
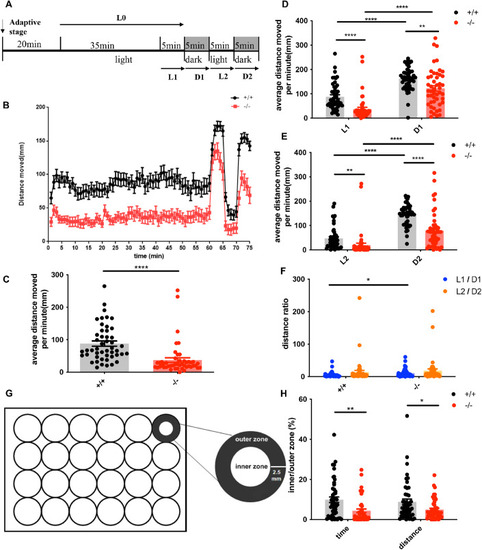
The locomotion and thigmotaxis behavior of 7-dpf WT and mutant zebrafish. ( PHENOTYPE:
|
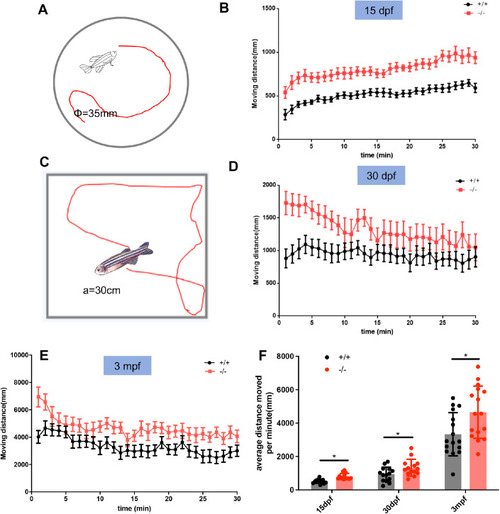
The locomotion of larval, juvenile, and adult WT and ( PHENOTYPE:
|
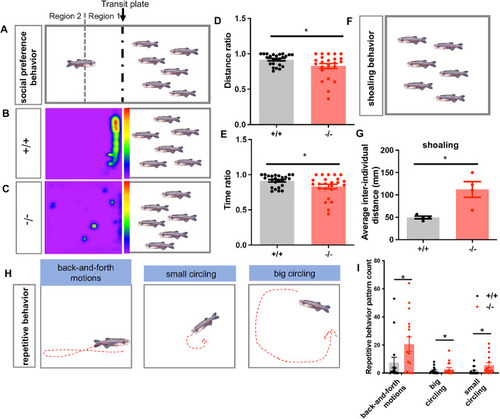
( PHENOTYPE:
|

Loss-of-function of ( |
( EXPRESSION / LABELING:
PHENOTYPE:
|
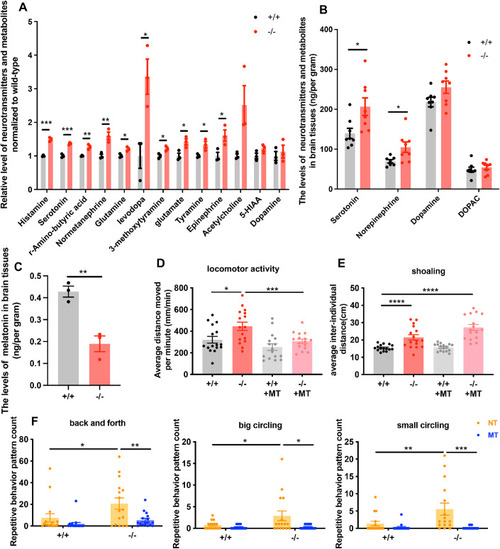
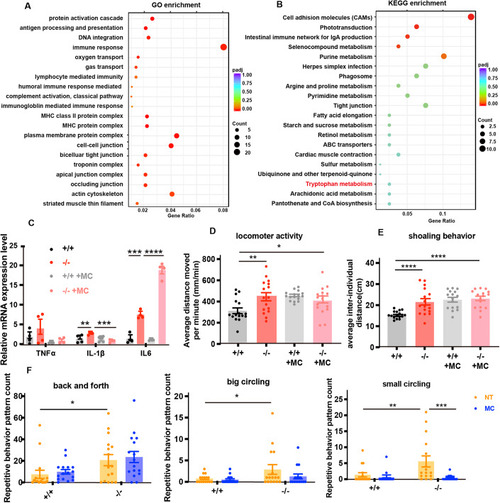
Melatonin treatment rescues overactive locomotor behavior and repetitive stereotypic behavior in ( PHENOTYPE:
|