FIGURE SUMMARY
Title

Induced formation of primordial germ cells from zebrafish blastomeres by germplasm factors

Authors
Wang, X., Zhu, J., Wang, H., Deng, W., Jiao, S., Wang, Y., He, M., Zhang, F., Liu, T., Hao, Y., Ye, D., Sun, Y.
Source
Full text @ Nat. Commun.

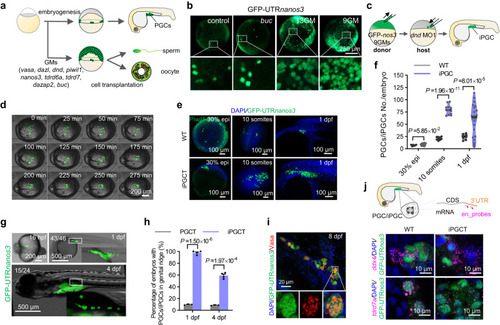
Generation of iPGC via germplasm in vivo.

a Scheme for the iPGC induction in vivo using germplasm. b At the 1-cell stage, zebrafish embryos were injected with buc (200 pg), 13GM (50 pg per fraction), or 9GM (50 pg per fraction) mRNA to induce iPGCs. GFP-UTRnanos3 was used to label putative PGCs. The embryos were photographed at 90% epiboly stage. c Schematic diagram for iPGCT. d Time-lapse of iPGC migration to the genital ridges after iPGCT. GFP-UTRnanos3 was used to label iPGCs. e GFP-UTRnanos3 was used to label PGCs and iPGCs, except that immunofluorescence against Piwil1 was used to visualize endogenous PGCs of wild-type embryos at 30% epiboly. f Number of PGCs in wild-type and iPGCT embryos at different stages. Each point represents an independent sample (n ≥ 6). g iPGCs migrated to the genital ridge of the host embryo. h Success rates of iPGCT and conventional PGCT at 1 dpf and 4 dpf. Each point represents an independent experiment (n ≥ 3). i Immunofluorescence detection of Vasa protein in GFP-UTRnanos3-positive iPGCs of iPGCT embryos at 8 dpf. j Probes were designed at the UTR of mRNA (en_probes) to distinguish neonatal mRNA, and single molecule in situ hybridization was used to detect the neonatal germplasm mRNA of ddx4 and tdrd7a in the GFP-UTRnanos3-positive iPGCs and ePGCs at 1 dpf. A representative example of three replicate is shown. All data are presented as mean values ± SEM. Two-tailed Student’s t-test was used to calculate the P values.

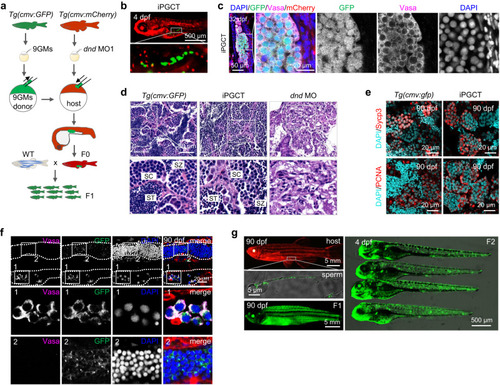
Functional gametes were obtained using iPGCT.

a Schematic diagram for iPGCT using Tg(cmv:GFP) embryos as iPGCT donors and Tg(cmv:mCherry) embryos as iPGCT hosts. b After iPGC transplantation, host embryos expressed mCherry and germ cells expressed GFP. c Immunofluorescence detection of Vasa in GFP-positive germ cells of iPGCT gonads at 32 dpf. Note that gonadal somatic cells expressed mCherry. d H&E staining of Tg(cmv:GFP) and iPGCT testes. SC spermatocyte, ST spermatid, SZ spermatozoa. e Immunofluorescence detection of Sycp3 and PCNA showing normal meiosis and mitosis of germ cells in iPGCT testis and control testis at 90 dpf. f Immunofluorescence detection of Vasa in GFP-positive germ cells of iPGCT testes at 90 dpf. Rectangular boxes 1 and 2 show the development of gonads on both sides of the iPGCT embryo, respectively. g The iPGCT fish expressing mCherry produced sperm expressing GFP, and F1 and F2 generations expressing GFP were obtained. A representative example of three replicate is shown.

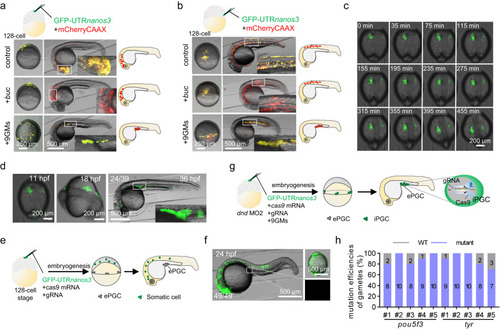
Functional gametes were produced by the single blastomere induction of iPGCs.

Injection of 9GM or buc mRNA into a single blastomere at the animal pole (a) or margin (b) of a 128-cell embryo. GFP-UTRnanos3 was used to label iPGCs, and mCherryCAAX was used to label injected cells. c Time-lapse of iPGC migration to the genital ridges after single blastomere injection. d Single blastomere-induced iPGCs migrated to the genital ridge. e, f Genome editing was performed in one blastomere at 128-cell stage without iPGC induction. Eventually, these genome-edited cells migrated to other parts of the body besides the genital ridge. g Schematic representation of simultaneous genome editing and iPGC induction in a single blastomere at 128-cell stage. Embryos were injected with a low dose of dnd MO2 (20 µM) at 1-cell stage to eliminate the endogenous PGC, and the single blastomere induced iPGCs developed into genome-edited gametes. h Mutation efficiencies of gametes originated from single blastomere induced iPGCs. For each fish, a total of 10 embryos obtained from the hybridization of genome-edited sperm originated from single blastomere induced iPGCs and wild-type eggs were analyzed. The mutation efficiency of 5 F0 fish (#1–#5) gametes is shown for each gene. A representative example of three replicate is shown.

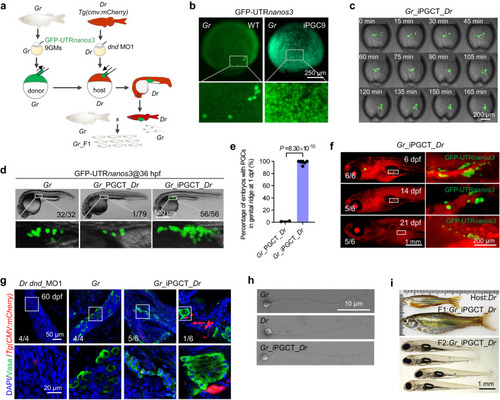
Generation of xenogametes by iPGCT.

a Schematic diagram for iPGCT using Gobiocypris rarus (Gr) as the donor and Tg(cmv:mCherry) zebrafish (Danio rerio, Dr) as the host. b At the 1-cell stage, Gr embryos were injected with zebrafish-derived 9GMs (50 pg per mRNA) to induce iPGCs. GFP-UTRnanos3 was used to label iPGCs. The embryos were photographed at 90% epibody. c Time-lapse of Gr_iPGCs migration to the genital ridges of Dr after transplantation. d Fluorescent image of conventional PGCT embryos and iPGCT embryos at 36 hpf. Gr_PGCT_Dr, Gr PGCs transplanted to PGC-depleted Dr embryos; Gr_iPGCT_Dr, 9GMs induced Gr iPGCs transplanted to PGC-depleted Dr embryos. e Success rate of iPGCT and conventional PGCT at 1 dpf. Each point represents an independent experiment (n ≥ 2), and at least 77 embryos were manipulated per experiment. A representative example of three replicate is shown. All data are presented as mean values ± SEM. Two-tailed Student’s t-test was used to calculate the P values. f Fluorescence imaging of GFP-UTRnanos3 positive Gr-derived iPGCs (Gr_iPGCs) in Tg(cmv:mCherry) zebrafish host. g Immunofluorescence detection of Vasa-positive germ cells in dnd_MO1 injected Dr (Dr dnd_MO1), Gr, and Gr_iPGCT_Dr testes at 60 dpf. h Morphology of the sperm of Gr, Dr and Gr_iPGCT_Dr. iGr_iPGCT_Dr sperm generated by Dr hosts produced F1 and F2 generations of Gr normally.

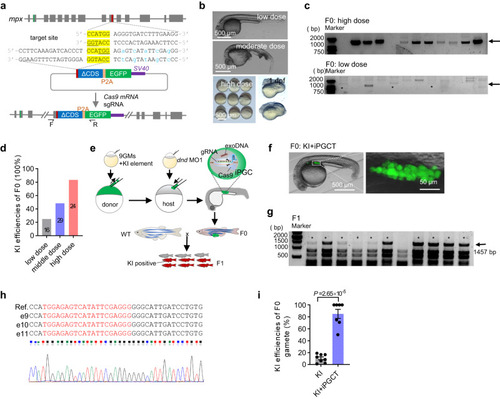
iPGCT greatly improved the knock-in (KI) efficiency of gametes.

a Schematic diagram of KI strategy mediated by microhomology-mediated end-joining (MMEJ). GFP was inserted into exon 10 of mpx and the missing CDS sequence was added in the KI vector. The underlined bases are PAM regions, the yellow bases are microhomology sequences, and the blue bases are bases with synonymous mutations. b With the increase of KI reagent doses, the embryos displayed increasingly serious abnormalities. Low dose (50 pg gRNA, 50 pg plasmid, and 500 pg cas9 mRNA); moderate dose (100 pg gRNA, 100 pg plasmid, and 1000 pg cas9 mRNA); and high dose (200 pg gRNA, 200 pg plasmid, and 1000 pg cas9 mRNA). c Single embryos were used to evaluate the efficiency of KI events. The arrow indicates the positive bands (1457 bp), and the asterisk represents the positive embryos at low dose. d KI efficiency of F0 embryos at different doses. The number on the column represents the total number of embryos tested. e Schematic diagram showing KI combined with iPGCT to efficiently produce KI progeny. f The iPGCT embryos harboring KI iPGCs were obtained according to the process illustrated in e. g F0 was mated with the wild-type, and 12 embryos were selected for identification one by one to evaluate the KI efficiency of F0 gamete. The arrow indicates the positive bands (1457 bp), and the asterisk represents the positive embryo. h Sequencing results of positive bands. gRNA target locations are marked in red. i KI efficiencies of F0 gametes producing positive F1. Each dot represents the rate of KI gametes from one F0 fish (n ≥ 7). A representative example of three replicate is shown. All data are presented as mean values ± SEM. Two-tailed Student’s t-test was used to calculate the P values.

Acknowledgments
This image is the copyrighted work of the attributed author or publisher, and ZFIN has permission only to display this image to its users. Additional permissions should be obtained from the applicable author or publisher of the image. Full text @ Nat. Commun.