IMAGE

Fig. 4

ID
ZDB-IMAGE-231218-10
Source
Figures for Wang et al., 2023
Image
Figure Caption

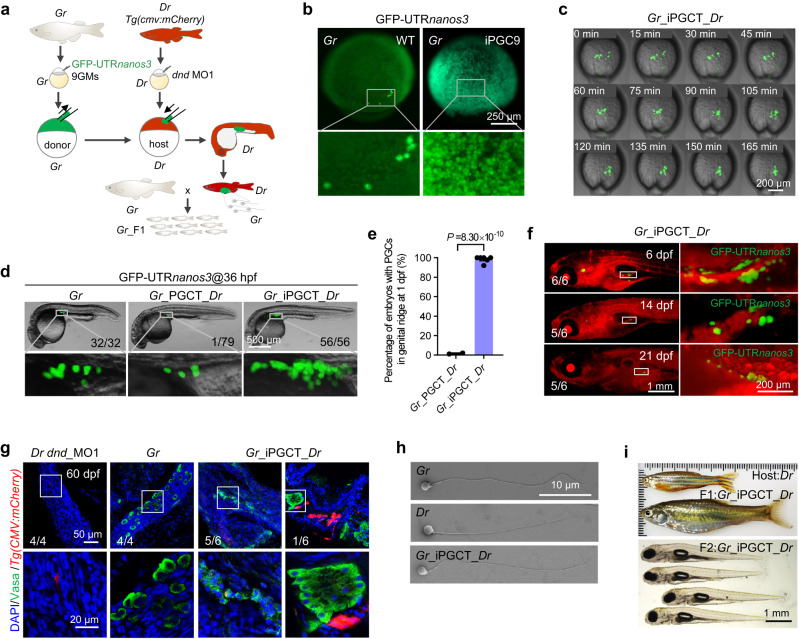
Fig. 4 Generation of xenogametes by iPGCT.

a Schematic diagram for iPGCT using Gobiocypris rarus (Gr) as the donor and Tg(cmv:mCherry) zebrafish (Danio rerio, Dr) as the host. b At the 1-cell stage, Gr embryos were injected with zebrafish-derived 9GMs (50 pg per mRNA) to induce iPGCs. GFP-UTRnanos3 was used to label iPGCs. The embryos were photographed at 90% epibody. c Time-lapse of Gr_iPGCs migration to the genital ridges of Dr after transplantation. d Fluorescent image of conventional PGCT embryos and iPGCT embryos at 36 hpf. Gr_PGCT_Dr, Gr PGCs transplanted to PGC-depleted Dr embryos; Gr_iPGCT_Dr, 9GMs induced Gr iPGCs transplanted to PGC-depleted Dr embryos. e Success rate of iPGCT and conventional PGCT at 1 dpf. Each point represents an independent experiment (n ≥ 2), and at least 77 embryos were manipulated per experiment. A representative example of three replicate is shown. All data are presented as mean values ± SEM. Two-tailed Student’s t-test was used to calculate the P values. f Fluorescence imaging of GFP-UTRnanos3 positive Gr-derived iPGCs (Gr_iPGCs) in Tg(cmv:mCherry) zebrafish host. g Immunofluorescence detection of Vasa-positive germ cells in dnd_MO1 injected Dr (Dr dnd_MO1), Gr, and Gr_iPGCT_Dr testes at 60 dpf. h Morphology of the sperm of Gr, Dr and Gr_iPGCT_Dr. iGr_iPGCT_Dr sperm generated by Dr hosts produced F1 and F2 generations of Gr normally.

Acknowledgments
This image is the copyrighted work of the attributed author or publisher, and ZFIN has permission only to display this image to its users. Additional permissions should be obtained from the applicable author or publisher of the image. Full text @ Nat. Commun.