
- Title
-
Aquilaria sinensis leaf tea affects the immune system and increases sleep in zebrafish
- Authors
- Tan, X., Wang, L., Smith, W.K., Sun, H., Long, L., Mao, L., Huang, Q., Huang, H., Zhong, Z.
- Source
- Full text @ Front Pharmacol

Effect of |
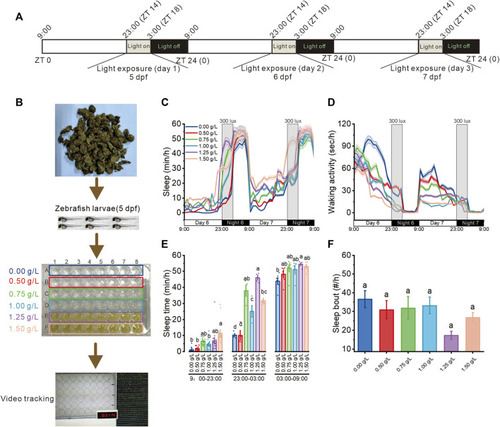
Effect of |
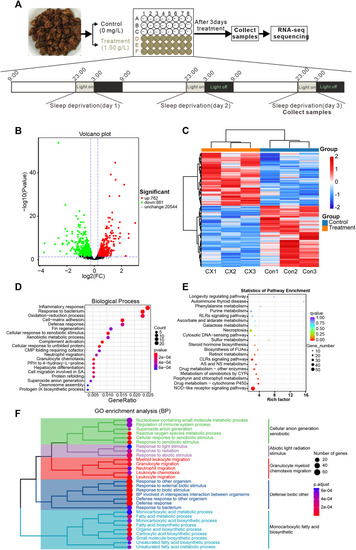
Transcriptome sequencing reveals changes in gene expression in zebrafish larvae exposed to |

Inflammatory response interacts with the NOD-like receptor signaling pathway from DEG between control and 1.50 g/L |

|
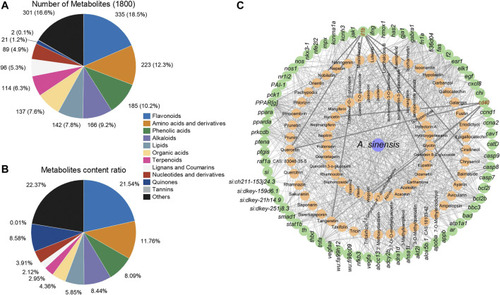
Analysis of metabolites in |

Eupatilin and quercetin, the potential active ingredients of |