
- Title
-
Hemogenic and aortic endothelium arise from a common hemogenic angioblast precursor and are specified by the Etv2 dosage
- Authors
- Zhao, S., Feng, S., Tian, Y., Wen, Z.
- Source
- Full text @ Proc. Natl. Acad. Sci. USA
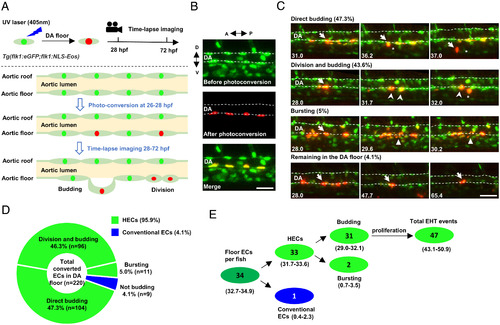
Time-lapse imaging indicates that the endothelium in the DA floor are HECs. (A) Schematic diagram showing the strategy of photoconversion of the floor endothelium in the DA and time-lapse imaging in Tg(flk1:eGFP;flk1:NLS-Eos) transgenic zebrafish. The green, red, and light green dots indicate the nuclei before photoconversion, the nuclei after photoconversion, and eGFP in the cytoplasm, respectively. (B) Representative images of the photoconverted floor endothelium at 26 hpf. (C) Images representing four types of behaviors of the DA floor endothelium during EHT (28 to 72 hpf) captured by time-lapse imaging. The dashed lines indicate the roof and floor boundaries of the DA, the white arrow indicates successfully converted cells, the white arrowhead indicates the descendants of labeled cells, the white triangle indicates bursting cells, and the asterisk indicates budding cells. Captured time points are labeled at the bottom left. (D) Summary of the behaviors of floor endothelium during 28 to 72 hpf captured by time-lapse imaging. (E) Estimated number of HECs and cECs in the DA floor per fish and their behaviors with 95% (CI). Data were analyzed with 220 cells by five independent experiments with 40 embryos. A, anterior; D, dorsal; P, posterior; V, ventral. (Scale bars, 30 µm.). |
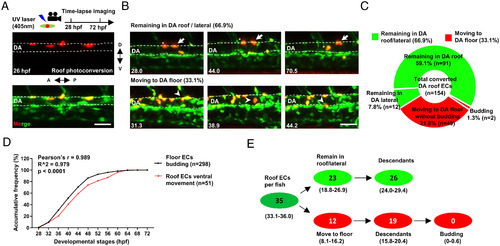
Time-lapse imaging reveals that the endothelium in the DA roof are cECs. (A) Schematic diagram showing the strategy of photoconversion in the DA roof endothelium and time-lapse imaging in Tg(flk1:eGFP;flk1:NLS-Eos) transgenic zebrafish. (B) Images representing two types of behaviors of the DA roof endothelium during 28 to 72 hpf captured by time-lapse imaging. The dashed line indicates the roof and floor boundary of the DA, the white arrow indicates cells remaining in the DA roof, the asterisk indicates cells remaining in the DA lateral, and the white arrowhead indicates cells moving to the DA floor. Captured time points are labeled at the bottom left. (C) Summary of the behaviors of the DA roof endothelium during 28 to 72 hpf captured by time-lapse imaging. (D) Line graph showing the accumulative frequency percentage (%) of the floor ECs budding (n = 298) and the roof ECs ventral movement (n = 51) during 28 to 72 hpf. Pearson correlation coefficient r was calculated according to the frequency distribution. (E) Estimated number of HECs and cECs in the DA roof per fish and their behaviors with 95% (CI). Data were analyzed with 154 cells by four independent experiments with 21 embryos. (Scale bars, 30 µm.). |
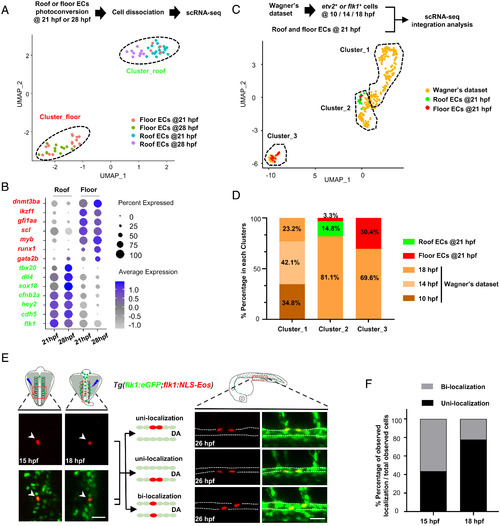
scRNA-seq and fate mapping analyses reveal that HECs and cECs arise from a common precursor and separate prior to the DA formation. (A) Isolation of single ECs from the DA roof or floor after photoconversion (21 hpf, roof/floor ECs, n = 18/18; 28 hpf, roof/floor ECs, n = 10/12) and UMAP plot for cell clustering analysis. (B) Dot plot showing representative marker genes expression enriched in the roof and floor ECs at 21 and 28 hpf. (C) UMAP plot of cell clustering analysis of integrated dataset (Wagner’s dataset at 10, 14, and 18 hpf and dataset at 21 hpf in this study). (D) Distribution percentage (%) of the cells from different time points in each cluster. (E) Single-cell photoconversion and fate mapping analysis in Tg(flk1:eGFP;flk1:NLS-Eos). (Left) Representative images showing single Eos cells photoconverted at 15 and 18 hpf. (Upper Left) Photoconverted areas (see details in Materials and Methods). (Right) Three different localization patterns at 26 hpf (roof and floor only or both in the DA) of the descendants ( 2) derived from a single converted Eos cell. (Upper Right) The observed DA region (see details in Materials and Methods). (F) Bar plot shows the percentage (%) of unilocalization and bilocalization cells in total converted cells at 15 hpf (number of cells: total n = 24; unilocalization n = 11; bilocalization n = 13) and 18 hpf (number of cells: total n = 45; unilocalization n = 35; bilocalization n = 10) stages. Data were acquired by two independent experiments (A) or analyzed by three independent photoconversion experiments (E and F). Cell numbers equal to embryo numbers for single-cell lineage tracing in F. (Scale bars, 30 µm.). |
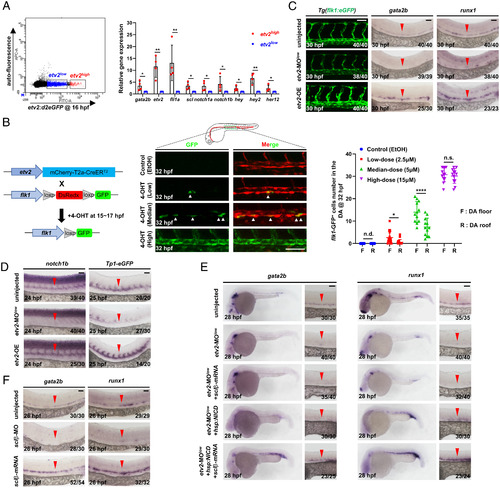
Etv2 dosage determines HEC and cEC fate through differentially regulating the activities of Fli1a, Notch, and Sclβ. (A) Flow cytometric and gene expression analysis of Tg(etv2:d2eGFP) embryos. Representative results of flow cytometric analysis at 16 hpf and relative genes expression levels in the etv2-d2eGFPhigh and etv2-d2eGFPlow population. (B) Strategy to perform lineage tracing using double transgenic line Tg(etv2:mCherry-T2a-CreER ;flk1:loxp-DsRedx-loxp-eGFP). Fish were treated with EtOH or different doses of 4-OHT during 15 to 17 hpf, and GFP ECs were quantified at 32 hpf. (C) Lateral views of the DA in Tg(flk1:eGFP) embryos and WISH of gata2b and runx1 in embryos. The embryos were injected with or without a low dose of etv2 MO (etv2-MOlow) to knockdown etv2 or heat-shocked to overexpress etv2 (etv2-OE). (D) WISH of notch1b and eGFP. The embryos were injected with or without a low dose of etv2 MO to knockdown etv2 or heat-shocked to overexpress etv2. (E) WISH of gata2b and runx1 indicates rescue of HECs. The embryos were uninjected or injected with a low dose of etv2 MO, together with or without overexpressing sclβ (mRNA injection) and NICD (heat shock) alone or both. (F) WISH of gata2b and runx1 in sclβ MO knockdown and sclβ overexpression embryos. The embryos were injected with or without sclβ MO or sclβ mRNA. Data are representative of two independent experiments (four biological replicates in A; for embryos, n = 12 in B) or two different clutches of embryos (C–F). n/N reports the number of embryos with staining pattern in image/total embryos (C–F). Heat shock was performed at 14 hpf for 45 min in C–E. Student’s t tests were used in A; two-way ANOVA test was used in B. Data are represented as mean ± SD, *P 0.05, **P 0.01, ****P 0.0001; n.s., not significant (P > 0.05); n.d., not detectable. (Scale bars, 60 µm.). |
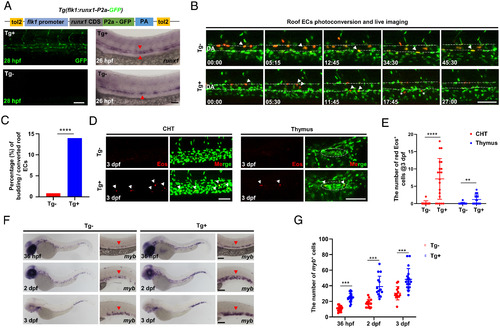
Runx1 overexpression promotes HEC fate in the DA roof. (A) Schematic graph showing the construction of Tg(flk1:runx1-P2a-GFP) with representative confocal images of stable F1 fish at 28 hpf and runx1 WISH at 26 hpf. (B) Representative behaviors of the photoconverted DA roof ECs captured by time-lapse imaging during 28 to 72 hpf in Tg (runx1 overexpression) and Tg (siblings without runx1 expression) embryos. The dashed lines denote the roof and floor walls of the DA, the triangles denote converted cells, and the asterisks denote budding cells. (C) Quantification of percentage (%) of the budding roof ECs divided by the photoconverted roof ECs (3/352 in Tg versus 57/408 in Tg). (D) Representative confocal images (after Z-projection) in CHT and thymus at 3 dpf. Fifteen DA roof ECs were photoconverted at 26 hpf in each Tg or Tg embryo, and red Eos cells were quantified at 3 dpf. The dashed circles denote the location of thymus. (E) Quantification of red Eos cells in CHT and thymus at 3 dpf. (F) WISH of myb in Tg and Tg embryos. (G) Quantification of myb cells. Data are representative of three independent experiments with 32 (Tg) and 40 (Tg) embryos in B and C or two different clutches of embryos with (36 hpf, Tg /Tg: n = 18/19; 2dpf, Tg /Tg: n = 15/15; 3dpf, Tg /Tg: n = 15/18) for myb WISH (F and G) or 11 (Tg) and 20 (Tg) embryos for photoconversion and quantification (D and E). Fisher’s exact test was used in C, unpaired Student’s t tests were used in E and G. **P 0.01, ***P 0.001, ****P 0.0001. (Scale bars, 60 µm.). |