
|
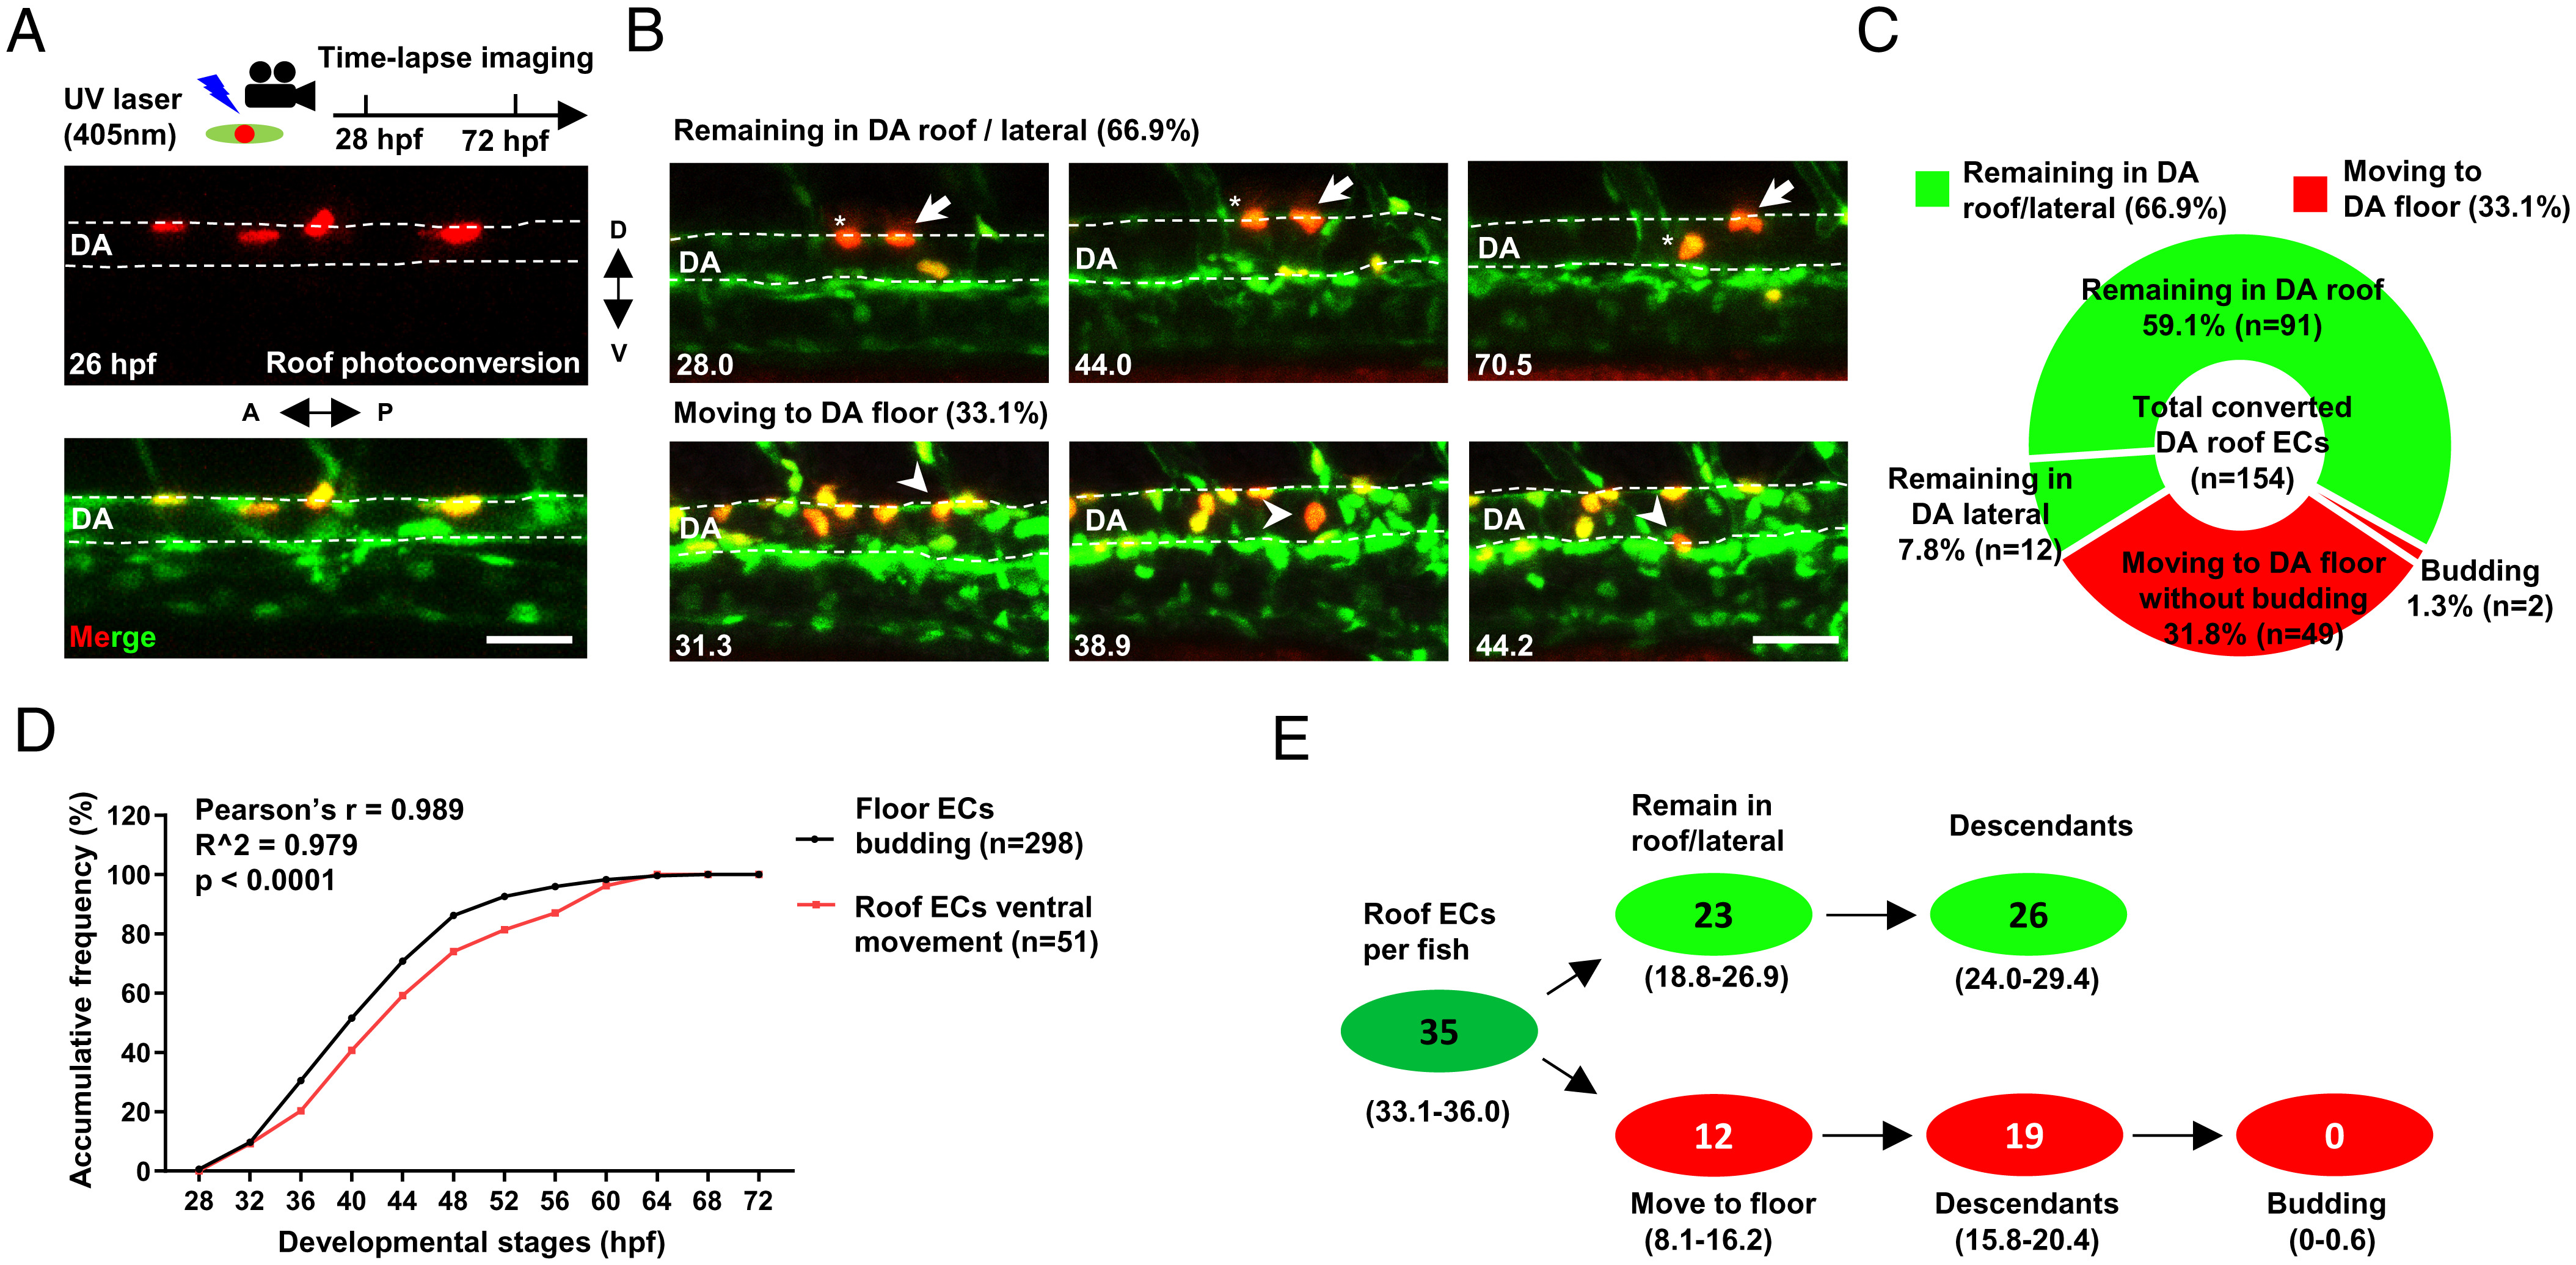
Fig. 2 Time-lapse imaging reveals that the endothelium in the DA roof are cECs. (A) Schematic diagram showing the strategy of photoconversion in the DA roof endothelium and time-lapse imaging in Tg(flk1:eGFP;flk1:NLS-Eos) transgenic zebrafish. (B) Images representing two types of behaviors of the DA roof endothelium during 28 to 72 hpf captured by time-lapse imaging. The dashed line indicates the roof and floor boundary of the DA, the white arrow indicates cells remaining in the DA roof, the asterisk indicates cells remaining in the DA lateral, and the white arrowhead indicates cells moving to the DA floor. Captured time points are labeled at the bottom left. (C) Summary of the behaviors of the DA roof endothelium during 28 to 72 hpf captured by time-lapse imaging. (D) Line graph showing the accumulative frequency percentage (%) of the floor ECs budding (n = 298) and the roof ECs ventral movement (n = 51) during 28 to 72 hpf. Pearson correlation coefficient r was calculated according to the frequency distribution. (E) Estimated number of HECs and cECs in the DA roof per fish and their behaviors with 95% (CI). Data were analyzed with 154 cells by four independent experiments with 21 embryos. (Scale bars, 30 µm.).