FIGURE SUMMARY
Title

Kif21a deficiency leads to impaired glomerular filtration barrier function

Authors
Riedmann, H., Kayser, S., Helmstädter, M., Epting, D., Bergmann, C.
Source
Full text @ Sci. Rep.

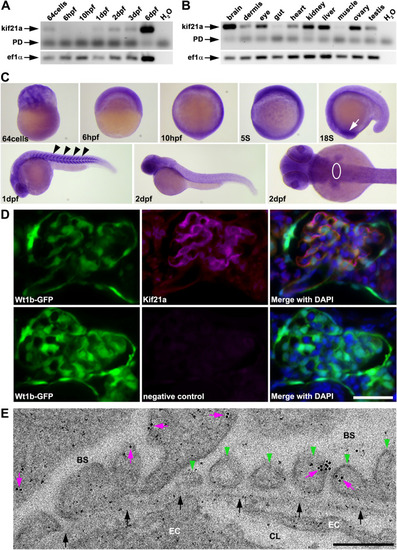
Kif21a shows a specific expression during zebrafish development and localized to the glomerular filtration barrier. (A, B) Expression analysis of kif21a in zebrafish using semiquantitative reverse-transcription polymerase chain reaction (RT-PCR) on cDNA of different developmental embryonic stages (A) and adult organs (B). H2O served as negative control and ef1α as loading control; Primer dimer (PD). The grouping of gel images cropped from different parts of the same gel image is delineated with white spaces. (C) Whole-mount in situ hybridization (WISH) analysis detecting temporal and spatial kif21a expression at different stages during zebrafish embryonic development (white arrow marks the optic stalk at 18 somite stage; black arrowheads mark the somites at 1 day post-fertilization (dpf); white circle depicts the glomerular area). (D) Glomerular sections of 5dpf old Tg(wt1b:GFP) zebrafish embryos (green) that were immunostained for Kif21a (magenta) and counterstained with DAPI (blue) as a nuclear marker. A respective immunostaining without the secondary antibody served as negative control. Scale bar represents 25 µm. (E) Representative electron micrograph showing immunogold-labelling of Kif21a (magenta arrows) in the glomerular region from 5dpf old zebrafish embryos. Green arrowheads point to podocyte foot processes and black arrows mark the glomerular basement membrane. Bowman’s space (BS), capillary lumen (CL), fenestrated endothelial cell (EC). Scale bar represents 250 nm. Unprocessed gel images for (A and B) are presented in Supplementary Fig. S2.

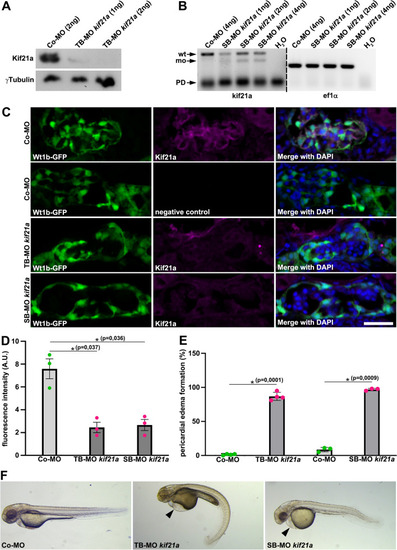
Kif21a deficiency results in pericardial edema formation and reduced glomerular Kif21a signal in zebrafish. (A) Immunoblotting studies on zebrafish lysates of 4dpf old embryos injected with Control (Co)-MO (2 ng) or translation-blocking Morpholino (TB-MO) kif21a (1 or 2 ng) using a specific Kif21a antibody. γTubulin served as loading control. The grouping of blot images cropped from different parts of the same blot image is delineated with a white space. (B) Expression analysis of kif21a using semiquantitative RT-PCR on cDNA of Co-MO (4 ng) or splice-blocking Morpholino (SB-MO) kif21a (1, 2 or 4 ng). Black arrows point to kif21a wildtype (wt) PCR product and morphant (mo) PCR splice product; Primer dimer (PD). H2O served as negative control and ef1α as loading control; dividing lines indicate different contrast from different parts of the same gel image. (C) Glomerular sections of 5dpf old Tg(wt1b:GFP) zebrafish embryos (green) that were injected with Co-MO (6 ng), TB-MO kif21a (2 ng) or SB-MO kif21a (6 ng), immunostained for Kif21a (magenta) and counterstained with DAPI (blue) as a nuclear marker. A respective immunostaining without the secondary antibody of a Co-MO injected embryo served as negative control. Scale bar represents 25 µm. (D) Quantification reveals significant reduced Kif21a levels in the glomerulus of embryos injected with TB-MO kif21a (2 ng) or SB-MO kif21a (6 ng) compared to Co-MO (6 ng) injected embryos; Arbitrary Unit (A.U.). The barchart represents the pooled data from 3 different embryos for each condition. (E) Quantification of pericardial edema formation of 2dpf old zebrafish embryos injected with Co-MO (6 ng), TB-MO kif21a (2 ng) or SB-MO kif21a (6 ng). The barchart represents the pooled data from 3 or 4 independent experiments for each condition, respectively; number (n) of total embryos analysed: Co-MO, n = 390; TB-MO kif21a, n = 384 and Co-MO, n = 290; SB-MO kif21a, n = 290. (F) Bright-field images of zebrafish embryos at 2dpf injected with Co-MO (6 ng), TB-MO kif21a (2 ng) or SB-MO kif21a (6 ng) (black arrowhead points to pericardial edema formation). Unprocessed blot and gel images (A and B, respectively) are presented in Supplementary Fig. S3.

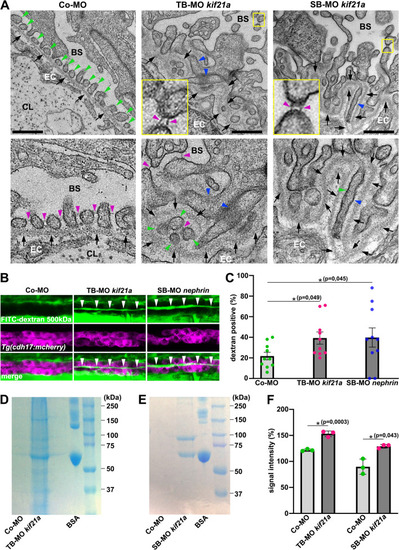
Kif21a deficiency results in defective podocyte morphology leading in a leaky glomerular filtration barrier and proteinuria. (A) Representative electron micrographs of glomerular region from 5dpf old zebrafish embryos injected with Co-MO (6 ng), TB-MO kif21a (1 ng) or SB-MO kif21a (6 ng). Green, blue and magenta arrowheads point to podocyte foot processes, podocyte foot process effacements and slit diaphragms, respectively. Black arrows point to glomerular basement membrane. Yellow-framed boxes represent magnifications of respective insets. Bowman’s space (BS), capillary lumen (CL), fenestrated endothelial cell (EC). Scale bars represent 500 nm. (B) Representative confocal images of 4dpf old Tg(cdh17:mcherry) embryos (expressing red fluorescent reporter protein in the pronephric tubules) injected with Co-MO (2 ng), TB-MO kif21a (1 ng) or SB-MO nephrin (2 ng) that were injected with 500 kDa FITC-dextran into the common cardinal vein at 80hpf. White arrowheads indicate the presence of 500 kDa FITC-dextran in the pronephric tubule lumen. (C) Quantification of 4dpf old embryos injected with Co-MO (2 ng), TB-MO kif21a (1 ng) or SB-MO nephrin (2 ng) that show the presence of 500 kDa FITC-dextran in their pronephric tubule lumen. The knockdown of nephrin, a well-established zebrafish model causing dysfunction of the GFB and proteinuria, served as positive control. The barchart represents the pooled data from 10 independent experiments for each condition; number (n) of total embryos analysed: Co-MO, n = 98; TB-MO kif21a, n = 100; SB-MO nephrin, n = 92). (D) SDS-PAGE analysis of processed urine samples of embryos injected with Co-MO (2 ng) or TB-MO kif21a (2 ng) for the identification of proteinuria. Bovine serum albumin (BSA) was used as positive control. (E) SDS-PAGE analysis of processed urine samples of embryos injected with Co-MO (6 ng) or SB-MO kif21a (6 ng) for the identification of proteinuria. BSA was used as positive control. (F) Quantification of SDS-PAGE signal intensity of embryos injected with Co-MO (2 or 6 ng), TB-MO kif21a (2 ng) or SB-MO kif21a (6 ng). The barchart represents the pooled data from 3 independent experiments for each condition. Unprocessed SDS-PAGE images (D and E) are presented in Supplementary Fig. S4.

Acknowledgments
This image is the copyrighted work of the attributed author or publisher, and ZFIN has permission only to display this image to its users. Additional permissions should be obtained from the applicable author or publisher of the image. Full text @ Sci. Rep.