
- Title
-
In situ quantification of osmotic pressure within living embryonic tissues
- Authors
- Vian, A., Pochitaloff, M., Yen, S.T., Kim, S., Pollock, J., Liu, Y., Sletten, E.M., Campàs, O.
- Source
- Full text @ Nat. Commun.
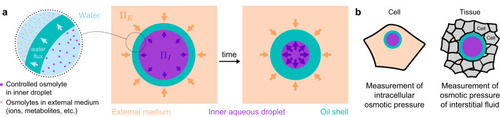
Double emulsion droplets as osmotic pressure sensors. |
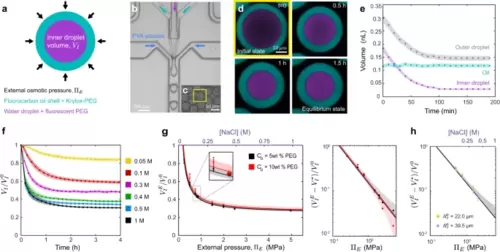
Characterization of double emulsion droplets at equilibrium. a Sketch of a double emulsion droplet indicating its composition and characteristics. Microfluidic generation (b) of double emulsion droplets (c). d Confocal section of a droplet in a 0.4 M NaCl solution over time showing the temporal reduction in droplet sizes. Fluorocarbon oil (cyan) and fluorescent PEG (purple) are shown (color code as sketched in a). e Temporal evolution of the inner droplet volume, (purple), the outer droplet volume, (gray) and the oil layer volume (cyan). Error bands are droplet segmentation errors. Representative case, N = 1. f Temporal evolution of the inner droplet volume, (normalized by the initial volume, ), for double emulsion droplets placed in NaCl solutions of varying osmolarities (Methods). N = 20 (yellow), 16 (red), 16 (purple), 15 (green), 21 (blue), 17 (black) droplets for f, g. Mean ± SD for f–h. g Measured dependence of the equilibrium inner droplet volume, (normalized by ), on the externally imposed osmotic pressure, , with initial PEG concentrations, c0 = 5% w/w (black circles) and 10% w/w (red circles). Linear scale, left panel; log-log scale, right panel. Black and red lines are fits of Eq. 1 to the data with associated confidence bands (68%). Measured equilibrium volumes of the inner droplet for droplets with c0 = 5% w/w (black asterisk) and 10% w/w (red asterisk) when placed in cell culture media of known osmolarity. N = 13 (black), 25 (red) droplets. Small inset is a magnified region of g. h Initial size dependence of, , on for droplets of initial radius, (large droplets, = 33.5 ± 0.6 µm, blue, N = 26 (0.5 MPa), 23 (0.75 MPa), 18 (1.5 MPa), 23 (2 MPa); small droplets: = 12.2 ± 0.3 µm, green, N = 26 (0.5 MPa), 23 (0.75 MPa), 18 (1.5 MPa), 23 (2 MPa)) but same c0 (5% w/w). Black line is the calibration curve (fit in g) for c0 = 5% w/w. CB (68%) is shown. Source data are provided as a Source Data file. |
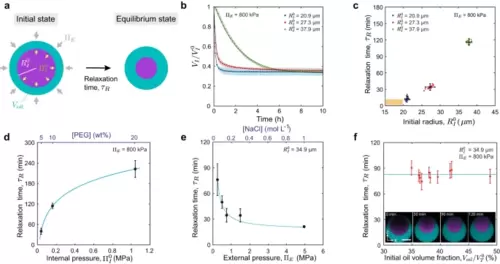
Pressure equilibration timescales of double emulsion droplets.a Sketch showing a double emulsion droplet of initial inner pressure and volume (or radius ) and initial oil volume , reducing its volume to the equilibrium values over a timescale . b Inner droplet volume relaxation (normalized to the initial volume ) for double emulsion droplets of different initial sizes: = 37.9 ± 0.7 µm (green, N = 20); = 27.3 ± 0.4 µm (red, N = 20); = 20.9 ± 0.3 µm (blue, N = 47). Initial PEG concentration (5% w/w) and fixed . Mean ± SD (represented by an error band). Black lines are exponential fits to the data (Methods). c–f, Dependence of the measured equilibrium relaxation timescale, , on the initial inner droplet size, (c initial PEG concentration (5% w/w) and fixed ; N = 20 (green), 20 (red), 47 (blue) droplets), the initial internal pressure, (d fixed and , N = 13 (5% w/w),18 (10% w/w), and 20 (20% w/w) droplets), the externally imposed osmolarity, (e initial PEG concentration (5% w/w) and fixed , N = 11 (0.25 MPa), 15 (0.5 MPa), 12 (0.75 MPa), 14 (1.5 MPa) and 16 (5.0 MPa) droplets), and the initial oil volume fraction, (f initial PEG concentration (10% w/w), fixed and ; N = 10 droplets), with being the initial total droplet volume. Inset in (f) shows z-x imaging plane of a droplet relaxing to the equilibrium state (fluorocarbon oil, cyan; fluorescent PEG, purple). Continuous blue lines in d and e are fits to the data with the form: . Scale bar, 25 µm. Mean ± SD for c–e. Mean ± error from exponential fit for f. Source data are provided as a Source Data file. |

In vivo and in situ measurements of osmotic pressure in blastomeres and in the interstitial fluid of zebrafish embryos |