IMAGE

Fig. 4

ID
ZDB-IMAGE-231106-15
Source
Figures for Vian et al., 2023
Image
Figure Caption

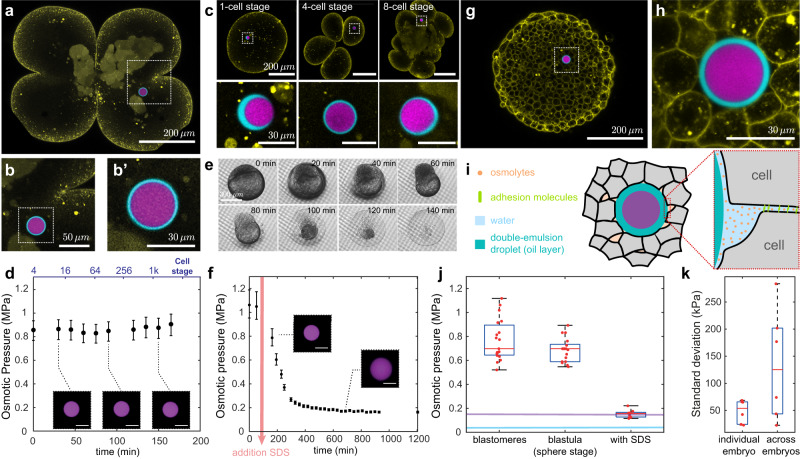
Fig. 4 In vivo and in situ measurements of osmotic pressure in blastomeres and in the interstitial fluid of zebrafish embryos

a Confocal section of a Tg(actb2: mem-NeonGreen)hm37 zebrafish embryo transitioning from the 2- to 4-cell stage (membranes, yellow) with a droplet (fluorescent PEG in inner droplet, purple; fluorocarbon oil, cyan) located in one of the blastomeres (cells). bb’, Close ups of the droplet in a. c Top panels: Confocal images of a droplet inside a cell of a developing zebrafish embryo at different developmental stages. Bottom panels: close ups of the droplet at each stage. d Representative example of measured time evolution of the intracellular osmotic pressure in a developing zebrafish embryo. N = 1. Mean ± measurement error bands (obtained by error propagation from calibration curve Fig. 2g) for d, f. e Timelapse of a zebrafish embryo in 2% w/w SDS solution imaged in an inverted microscope (transmitted light) and sustained on a porous membrane (Methods). f Representative time evolution of the osmotic pressure during SDS treatment (2% w/w SDS). N = 1. Insets show inner droplet equatorial confocal sections at different timepoints. g Confocal section of a zebrafish embryo blastula at sphere stage (4 hpf; same color code as in a) with a droplet inserted in the interstitial fluid between the cells. h Close up showing the equatorial confocal section of the droplet in g. i Schematic representation of the droplet in between adhering cells and the presence of osmolytes in the interstitial fluid. j Measured osmotic pressure inside blastomeres, between the cells (interstitial fluid) of the zebrafish blastula and after SDS treatment. N = 18, 20 and 10 droplets (1 droplet per embryo), respectively. Osmotic pressure of E3 buffer (embryo medium) with (violet line) and without (blue line) 2% w/w SDS, measured with a commercial osmometer (Methods). k Measured osmotic pressure variation (SD) of temporal readings in individual embryo (SD of temporal readings; N = 1) and across the different embryos (SD; N = 6). Boxplot show Median, 25th and 75th percentiles, whiskers extend to extreme data points. Source data are provided as a Source Data file.

Acknowledgments
This image is the copyrighted work of the attributed author or publisher, and ZFIN has permission only to display this image to its users. Additional permissions should be obtained from the applicable author or publisher of the image. Full text @ Nat. Commun.