- Title
-
Suramin, a drug for the treatment of trypanosomiasis, reduces the prothrombotic and metastatic phenotypes of colorectal cancer cells by inhibiting hepsin
- Authors
- Zaragoza-Huesca, D., Rodenas, M.C., Peñas-Martínez, J., Pardo-Sánchez, I., Peña-García, J., Espín, S., Ricote, G., Nieto, A., García-Molina, F., Vicente, V., Lozano, M.L., Carmona-Bayonas, A., Mulero, V., Pérez-Sánchez, H., Martínez-Martínez, I.
- Source
- Full text @ Biomed. Pharmacother.
|
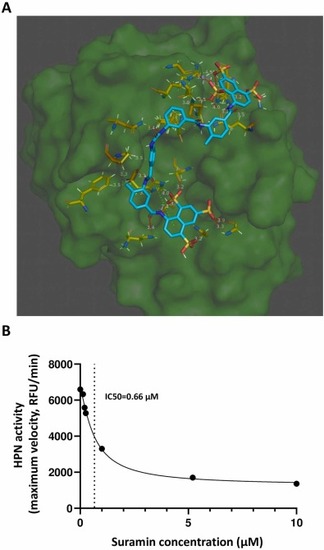
Hepsin inhibition by suramin. A) Suramin blocks access to the hepsin catalytic site. Hepsin is shown as a green background. The suramin backbone is shown in light blue. Hepsin residues interacting with suramin are shown in yellow. Hydrophobic interactions are shown as gray dashed lines, hydrogen bonds as orange and red dashed lines, salt bonds as yellow dashed lines, and the pi-stacking interaction as a green dashed line. The numbers next to each interaction correspond to the distance in Angstroms of the bond. B) In the fluorogenic assay, the proteolytic activity of hepsin decreases with increasing suramin concentration. IC50: suramin concentration required to reduce the proteolytic activity of HPN by 50 %; RFU/min: relative fluorescence units/minute. |
|
Effect of suramin on the migration and invasion phenotypes of Caco-2 cells. A) Percentage of wound healing or migration phenotype for Caco-2-EV and Caco-2-HPN cells incubated with or without suramin. The bars in the graph represent the mean and standard deviation of three different replicates. Statistical differences were analyzed by the unpaired t-test. On the right, bright field microscopy shows the migration front of cells 72 h after wound generation. These images correspond to one representative replicate for each condition. B) Percentage degraded area in the gelatin matrix, or invasion phenotype, for Caco-2-EV and Caco-2-HPN cells incubated with or without suramin. The bars in the graph represent the mean and standard deviation of six different replicates. Statistical differences were analyzed by the unpaired t-test. On the right, black dots represent Caco-2 cells degrading the gelatin matrix 72 h after seeding. These images correspond to one representative replicate for each condition. Caco-2-EV: Caco-2 cells with basal expression of hepsin; Caco-2-HPN: Caco-2 cells with hepsin overexpression; ns: not significant differences; * ** : p-value < 0.001; * *: p-value < 0.01. |
|
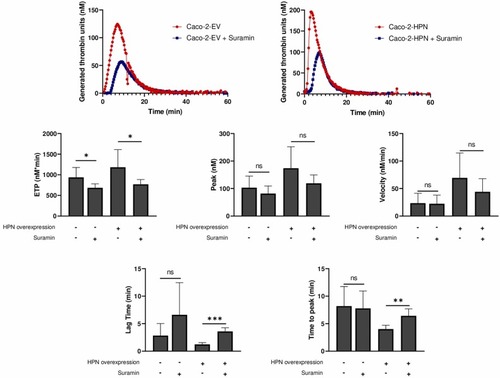
Effect of suramin on thrombin generation induced by Caco-2 cells. Thrombograms represent thrombin generation over time in plasma incubated with Caco-2 cells with basal or overexpression of hepsin and pretreated or not with suramin. These thrombograms show one representative replicate for each condition. Bar graphs show various parameters of these thrombograms and represent the mean and standard deviation of five different replicates. Statistical differences were analyzed by the unpaired t-test. Caco-2-EV: Caco-2 cells with basal expression of hepsin; Caco-2-HPN: Caco-2 cells with hepsin overexpression; ETP: endogenous thrombin potential; ns: not significant differences; * ** : p-value < 0.001; * *: p-value < 0.01; * : p-value < 0.05. |
|
Effect of suramin on thrombin generation induced by DLD-1 and HCT-116 cells. Thrombograms represent thrombin generation over time in plasma incubated with DLD-1 or HCT-116 and pretreated or not with suramin. These thrombograms show one representative replicate for each condition. Bar graphs show various parameters of these thrombograms and represent the mean and standard deviation of five different replicates. Statistical differences were analyzed by the unpaired t-test. ETP: endogenous thrombin potential; ns: not significant differences; * : p-value < 0.05. |
|
Suramin suppresses HPN’s effect on Caco-2 invasion in vivo. A) Fluorescence microscopy image showing invasion of Caco-2 cells in zebrafish larvae. B) Percentage of invaded larvae; comparison between larvae injected with Caco-2-EV, Caco-2-HPN, and Caco-2-HPN cells preincubated with 0.66 µM suramin. Statistical differences were calculated using the chi-square test in contingency tables. Invaded: larvae with cell invasion; No-Invaded: larvae without cell invasion; N: total number of larvae per group; * *: p-value < 0.01. |
|
|


