
- Title
-
A mechano- and heat-gated two-pore domain K+ channel controls excitability in adult zebrafish skeletal muscle
- Authors
- Idoux, R., Exbrayat-Héritier, C., Sohm, F., Jaque-Fernandez, F., Vaganay, E., Berthier, C., Bretaud, S., Jacquemond, V., Ruggiero, F., Allard, B.
- Source
- Full text @ Proc. Natl. Acad. Sci. USA

Unitary conductance, voltage, and heat sensitivity of mechano-gated K+ channels in cell-attached patches of adult zebrafish skeletal muscle fibers. (A) Activation of single-channel outward currents at 0 mV in response to negative pressure applied in the patch pipette. (B) Increase in channel opening in response to increasing negative pressures in a same patch held at 0 mV (Left). Relationship between the mean relative channel activity and negative pressure applied in the pipette in patches held at 0 mV (n = 7). (C) Single-channel currents through mechano-gated channels at the indicated membrane potentials (Upper) and relationship between mean unitary current amplitudes and membrane potential (Lower) in the presence of 5 mM K+ in the pipette. (D) Same as in C but in the presence of 140 mM K+ in the pipette. (E) Relationship between the mean relative channel activity and membrane potential with continuous application of −4 kPa in the pipette. (F) Increase in channel activity in response to exchange of a 20 °C to a 37 °C external solution. |

Effects of stretch, AA, heat, and pH changes on mechano-gated K+ channels in inside-out patches of adult zebrafish skeletal muscle fibers. (A) Activation of single-channel outward currents in response to negative pressure applied in the patch pipette. (B) Increase in channel activity in response to exposition of the cytoplasmic face to AA. (C) Increase in channel activity in response to exchange of a 20 °C to a 37 °C superfused internal solution. (D) Absence of effect of acidification of the superfused internal solution on channel activated by applying negative pressure in the pipette (three large deflections at the beginning of the current trace). (E) Increase in channel activity in response to alkalization of the superfused internal solution. The horizontal bars indicate the period during which negative pressure, AA, 37 °C solution, and pH changes are applied. The patch membrane was held at 0 mV. Insets in B–D show the current trace at the level of *on an expanded scale |
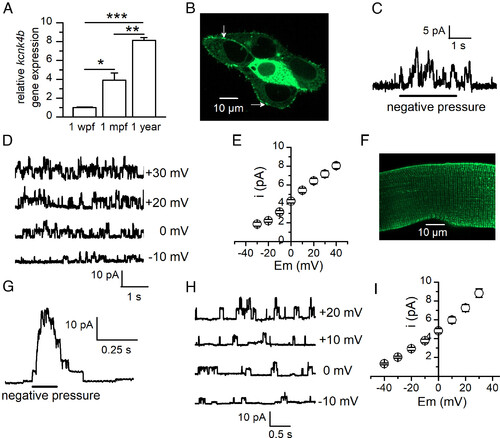
Expression of the kcnk4b gene in trunk muscle of developing zebrafish and channel activity of kcnk4b heterologously expressed in HEK-293 cells and in mouse skeletal muscle fibers. (A) Relative quantification of kcnk4b gene by real-time RT-PCR analysis using RNA extracts of 1-wk postfertilization trunks (n = 30 for each experiment), skeletal muscle isolated from 1-mo postfertilization trunks (n = 4 for each experiment), and 1-y old adult fish trunks (n = 1 for each experiment). Three independent experiments were performed. Data were normalized to polr2d. Expression levels were compared to kcnk4b gene expression at 1 wpf, which was arbitrarily set to 1. (B) Confocal image of HEK cells expressing TRAAK-GFP proteins. Arrows indicate the TRAAK-GFP-positive membrane regions on which patch pipettes were sealed. (C) Burst of single-channel outward currents evoked at 0 mV in response to negative pressure applied in a patch pipette sealed on a TRAAK-GFP-positive membrane region of a HEK cell membrane. (D) Recording of single-channel activity elicited by negative pressure in HEK cell-attached patches held at different membrane potentials. (E) Relationship between mean stretch-activated unitary current amplitudes in HEK cell–attached patches and membrane potential (n = 11). (F) Confocal image of a mouse muscle fiber expressing TRAAK-GFP protein after electroporation of kcnk4b-EGFP plasmid. (G) Burst of single-channel outward currents evoked at 0 mV in response to a brief negative pressure applied in a patch pipette sealed on the GFP-positive region of a mouse muscle cell. (H) Recording of single-channel activity elicited by negative pressure in mouse muscle cell–attached patches held at different membrane potentials. (I) Relationship between mean stretch-activated unitary current amplitudes in mouse muscle cell-attached patches and membrane potential (n = 14). For all cell-attached experiments, Tyrode and K+-rich solution were present in the pipette and in the bath, respectively. |
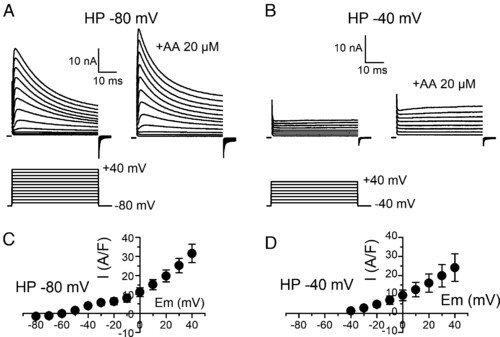
Effects of AA on whole-cell K+ currents in adult zebrafish skeletal muscle fibers. (A) Increase in outward K+ currents (Upper traces) elicited by depolarizing pulses of increasing amplitudes (Lower traces) from a holding potential of −80 mV in response to AA exposure. (B) Same as in A in the same fiber from a holding potential of −40 mV. (C) Relationship between the mean current difference (end pulse current in the presence of AA minus end pulse control current) and voltage in eight fibers depolarized from a holding potential of −80 mV. (D) Same as in C for the same fibers depolarized from a holding potential of −40 mV. |

Effects of heat on whole-cell K+ currents in voltage-clamped adult zebrafish skeletal muscle fibers. (A) Increase in outward K+ currents (Upper traces) elicited by depolarizing pulses of increasing amplitudes (Lower traces) from a holding potential of −80 mV in response to heat. (B) Same as in A in the same fiber from a holding potential of −40 mV. (C) Relationship between the mean current difference (end pulse current at 37 °C minus end pulse current at 20 °C) and voltage in eight fibers depolarized from a holding potential of −80 mV. (D) Same as in C for the same fibers depolarized from a holding potential of −40 mV. |

Effects of cell compression on whole-cell K+ currents in voltage-clamped adult zebrafish skeletal muscle fibers. (A) Increase in outward K+ currents (Upper traces) elicited by successive depolarizing ramps (Lower traces) bringing the membrane potential from −80 mV to +40 mV in 0.5 s every 2 s, preceded by a 50-ms pulse to −90 mV. The horizontal bar indicates the period during which cell was compressed. (B) Currents (Upper traces) before and during cell compression evoked by voltage ramps (Lower trace). Currents correspond to currents recorded at the level of * and ** in A on an expanded scale. (C) Relationship between the mean current difference (current during minus current before cell compression) and voltage (n = 6). |
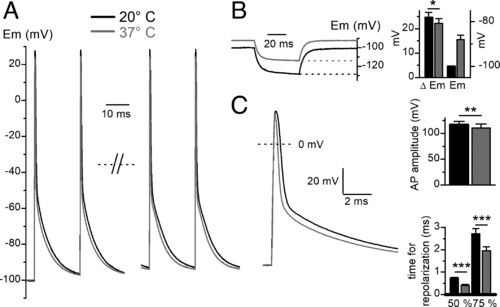
Effects of heat on AP and resting membrane potential in current-clamped adult zebrafish skeletal muscle fibers. (A) Changes of AP induced by warming of the external solution. The two first and the two last AP in a 0.5-s 50-Hz train of APs are presented at 20 and 37 °C in the same fiber after re-establishing the resting potential at −100 mV at 37 °C. (B) Depolarization of the resting membrane potential and reduction in the voltage change induced by a 50-ms current step of −2 nA at 20° C and 37 °C in the same fiber before re-establishing the resting potential at −100 mV at 37 °C (Left). Histogram showing mean voltage change induced by negative current step (Left axis) and mean resting membrane potential (Right axis) at 20 °C and 37 °C in seven fibers (Right). (C) Superimposition of the first AP of the train shown in A at 20 °C and 37 °C on an expanded scale (Left). Histogram showing mean change in AP amplitude and mean elapsed time between AP peak and 50% or 75% repolarization induced by heat in the same fibers (n = 7) (Right). |
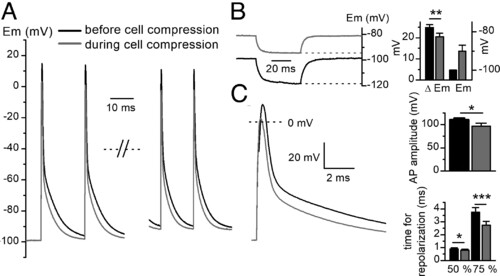
Effects of cell compression on AP and resting potential in current-clamped adult zebrafish skeletal muscle fibers. (A) Changes of AP induced by cell compression. The two first and the two last AP in a 0.5-s 50-Hz train of AP are presented before and during cell compression in the same fiber after re-establishing the resting potential at −100 mV during cell compression. (B) Depolarization of the resting membrane potential and reduction in the voltage change induced by a 50-ms current step of −2 nA before and during cell compression in the same fiber before re-establishing the resting potential at −100 mV during cell compression (Left). Histogram showing mean voltage change induced by the negative current step (Left axis) and mean resting membrane potential (Right axis) before and during cell compression in six fibers (Right). (C) Superimposition of the first AP of the train shown in A before and during cell compression on an expanded scale (Left). Histogram showing mean change in AP amplitude and mean elapsed time between AP peak and 50% or 75% repolarization induced by cell compression in the same fibers (n = 6) (Right). |