FIGURE SUMMARY
Title

Study on Carbohydrate Metabolism in Adult Zebrafish (Danio rerio)

Authors
Xi, L., Lu, Q., Liu, Y., Gong, Y., Liu, H., Jin, J., Zhang, Z., Yang, Y., Zhu, X., Han, D., Xie, S.
Source
Full text @ Aquac Nutr

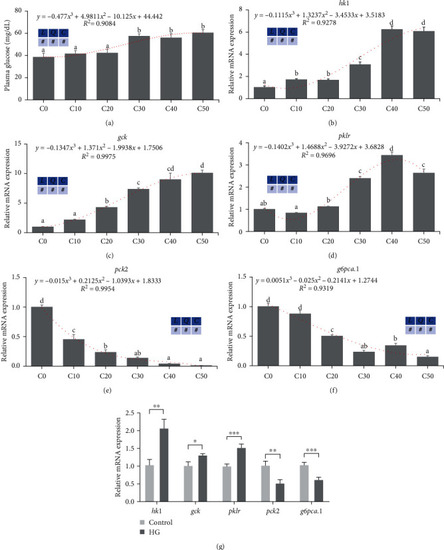
Excess carbohydrates activated glycolysis and suppressed gluconeogenesis in zebrafish and ZFL (means ± SEM, n = 6). C0, C10, C20, C30, C40, and C50 represent diets in which dextrin levels are 0%, 10%, 20%, 30%, 40%, and 50%, respectively. L represents a linear trend, Q represents a quadratic trend, C represents a cubic trend, and # represents the significant of the corresponding regressions. HG represents high glucose. (a) Plasma glucose, (b–d) glycolysis-related genes' expression in zebrafish liver, (e and f) gluconeogenesis-related genes' expression in zebrafish liver, and (g) glycolysis and gluconeogenesis related genes' expression in ZFL. Labeled means without a common letter differ among C0, C10, C20, C30, C40, and C50, P < 0.05 (one-way ANOVA, Duncan's post hoc test).  P < 0.05,  P < 0.01,  P < 0.005 (two-tailed independent t-test).

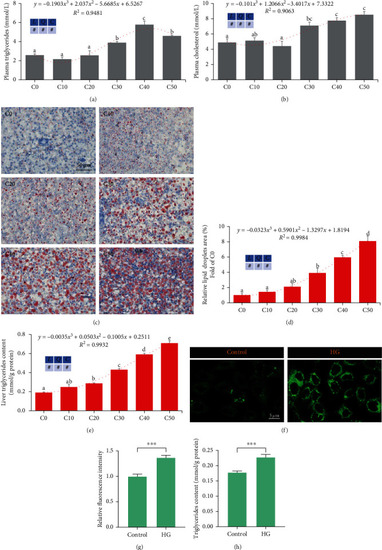
Excess carbohydrates elevated lipid accumulation in zebrafish and ZFL (means ± SEM, n = 6). C0, C10, C20, C30, C40, and C50 represent diets in which dextrin levels are 0%, 10%, 20%, 30%, 40%, and 50%, respectively. L represents a linear trend, Q represents a quadratic trend, C represents a cubic trend, and # represents the significant of the corresponding regressions. HG represents high glucose. (a) Plasma triglycerides, (b) plasma cholesterol, (c) representative images of the liver oil red O staining, scale bar, 50 μm, (d) relative areas of lipid droplets in oil red O staining, (e) triglycerides in the liver of zebrafish, (f) representative images of BODIPY staining in ZFL, scale bar, 5 μm, (g) lipid content was quantified by mean green fluorescence intensity by BODIPY 493/503 staining, and (h) triglycerides content in ZFL. Labeled means without a common letter differ among C0, C10, C20, C30, C40, and C50, P < 0.05 (one-way ANOVA, Duncan's post hoc test).  P < 0.005 (two-tailed independent t-test).

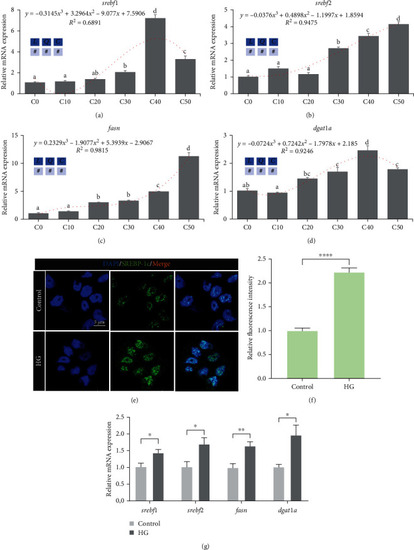
Excess carbohydrates promoted lipogenesis in zebrafish and ZFL (means ± SEM, n = 6). C0, C10, C20, C30, C40, and C50 represent diets in which dextrin levels are 0%, 10%, 20%, 30%, 40%, and 50%, respectively. L represents a linear trend, Q represents a quadratic trend, C represents a cubic trend, and # represents the significant of the corresponding regressions. HG represents high glucose. (a–d) Lipogenesis-related genes' expression in zebrafish liver, (e) representative images of SREBP-1c immunofluorescence staining in ZFL, scale bar, 5 μm, (f) SREBP-1c was quantified by mean green fluorescence intensity by immunofluorescence staining in ZFL, and (g) lipogenesis-related genes' expression in ZFL. Labeled means without a common letter differ among C0, C10, C20, C30, C40, and C50, P < 0.05 (one-way ANOVA, Duncan's post hoc test).  P < 0.05,  P < 0.01,  P < 0.005 (two-tailed independent t-test).

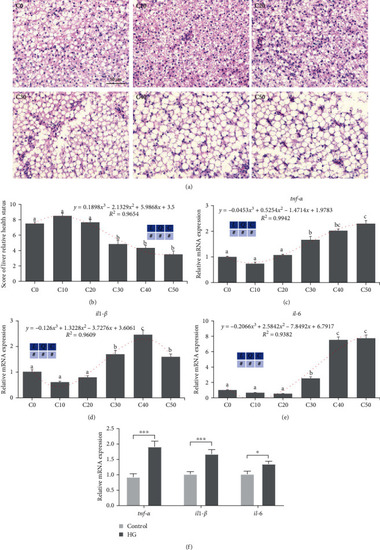
Excess carbohydrates damaged zebrafish liver health and increased inflammation-related genes in zebrafish liver and ZFL (means ± SEM, n = 6). C0, C10, C20, C30, C40, and C50 represent diets in which dextrin levels are 0%, 10%, 20%, 30%, 40%, and 50%, respectively. L represents a linear trend, Q represents a quadratic trend, C represents a cubic trend, and # represents the significant of the corresponding regressions. HG represents high glucose. (a) Representative images of the liver H&E staining, scale bar, 50 μm, (b) the relative health status of the liver was scored according to the degree of vacuolization (1–2: severe damage, 3–4: moderate, 5–6: mild, 7–8: slight, 9–10: normal), (c–e) inflammation-related genes' expression in zebrafish liver, and (f) inflammation-related genes' expression in ZFL. Labeled means without a common letter differ among C0, C10, C20, C30, C40, and C50, P < 0.05 (one-way ANOVA, Duncan's post hoc test).  P < 0.05,  P < 0.005 (two-tailed independent t-test).

Acknowledgments
This image is the copyrighted work of the attributed author or publisher, and ZFIN has permission only to display this image to its users. Additional permissions should be obtained from the applicable author or publisher of the image. Full text @ Aquac Nutr