IMAGE

Figure 4

ID
ZDB-IMAGE-231030-85
Source
Figures for Xi et al., 2023
Image
Figure Caption

Figure 4

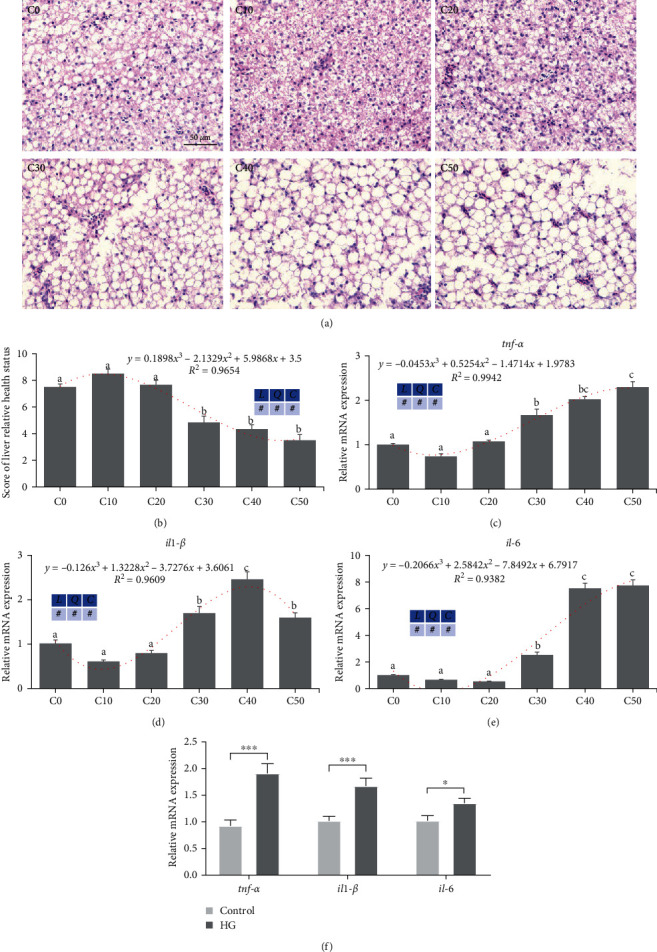
Excess carbohydrates damaged zebrafish liver health and increased inflammation-related genes in zebrafish liver and ZFL (means ± SEM, n = 6). C0, C10, C20, C30, C40, and C50 represent diets in which dextrin levels are 0%, 10%, 20%, 30%, 40%, and 50%, respectively. L represents a linear trend, Q represents a quadratic trend, C represents a cubic trend, and # represents the significant of the corresponding regressions. HG represents high glucose. (a) Representative images of the liver H&E staining, scale bar, 50 μm, (b) the relative health status of the liver was scored according to the degree of vacuolization (1–2: severe damage, 3–4: moderate, 5–6: mild, 7–8: slight, 9–10: normal), (c–e) inflammation-related genes' expression in zebrafish liver, and (f) inflammation-related genes' expression in ZFL. Labeled means without a common letter differ among C0, C10, C20, C30, C40, and C50, P < 0.05 (one-way ANOVA, Duncan's post hoc test).  P < 0.05,  P < 0.005 (two-tailed independent t-test).

Acknowledgments
This image is the copyrighted work of the attributed author or publisher, and ZFIN has permission only to display this image to its users. Additional permissions should be obtained from the applicable author or publisher of the image. Full text @ Aquac Nutr