- Title
-
Evaluation and Mechanistic Study of Transgenerational Neurotoxicity in Zebrafish upon Life Cycle Exposure to Decabromodiphenyl Ethane (DBDPE)
- Authors
- Sun, Y., Wang, X., Zhou, S., Zhou, Y., Hua, J., Guo, Y., Wang, Y., Zhang, W., Yang, L., Zhou, B.
- Source
- Full text @ Env. Sci. Tech.
|
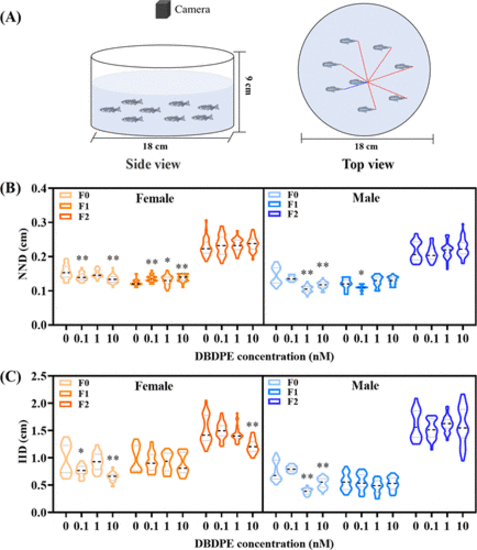
Effects of DBDPE exposure on zebrafish shoaling behavior. (A) Device diagram; (B) nearest-neighbor distance (NND); (C) interindividual distance (IID). NND: The average distance between any fish and its nearest neighbor; IID: The average distance between any fish and all other fish. The black line in the violin plot represents the median, and the dashed lines above and below the black line represent the 25th and 75th percentiles, respectively. *P < 0.05 and **P < 0.01 indicate significant differences between exposure groups and corresponding control group. |
|
Effects of DBDPE exposure on zebrafish social preference behavior. (A) Apparatuses and flowchart; regional residence time of (B) F0 female, (C) F1 female, (D) F2 female, (E) F0 male, (F) F1 male, and (G) F2 male. The black line in the violin plot represents the median, and the dashed lines above and below the black line represent the 25th and 75th percentiles, respectively. *P < 0.05 and **P < 0.01 indicate significant differences between exposure groups and the corresponding control group. |
|
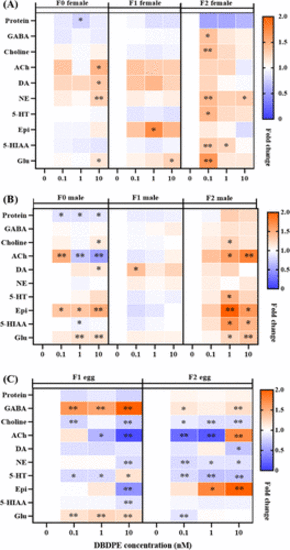
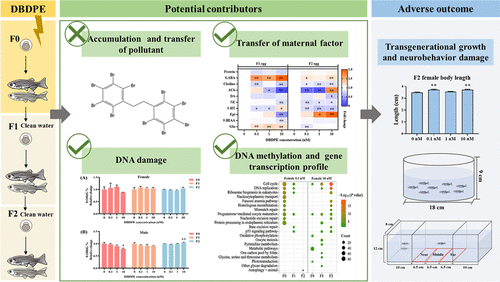
Changing profiles of protein and neurotransmitters in the brains of (A) female, (B) male zebrafish, and (C) in the eggs. *P < 0.05 and **P < 0.01 indicate significant differences between exposure groups and corresponding control group. GABA: γ-aminobutyric; ACh: acetylcholine; DA: dopamine; NE: norepinephrine; 5-HT: serotonin; Epi: epinephrine; 5-HIAA: 5-hydroxyindoleacetic acid; Glu: glutamate. The blue indicates down-regulation, while the orange indicates up-regulation, and the color intensity is proportional to the magnitude of changes. |
|
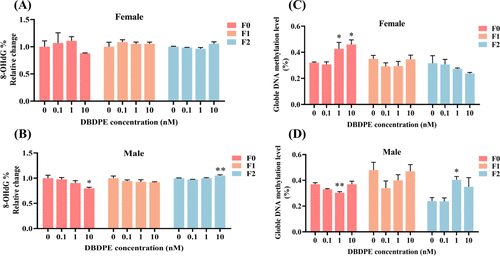
Relative change of 8-OHdG and global DNA methylation levels in zebrafish brain. Relative change of 8-OHdG in (A) female and (B) male zebrafish; global DNA methylation levels in (C) female and (D) male zebrafish. Data are expressed as the mean ± standard error of the mean (SEM) of three replicates. *P < 0.05 and **P < 0.01 indicate significant differences between the exposure and control groups. |
|
Analysis of differentially expressed genes (DEGs) in zebrafish brain. Number of DEGs with increased or decreased abundances in (A) female and (B) male; KEGG pathways of significant enrichment (top ten) in (C) female and (D) male. Color intensity is proportional to P value, and circular area represents the number of enriched genes. |
|
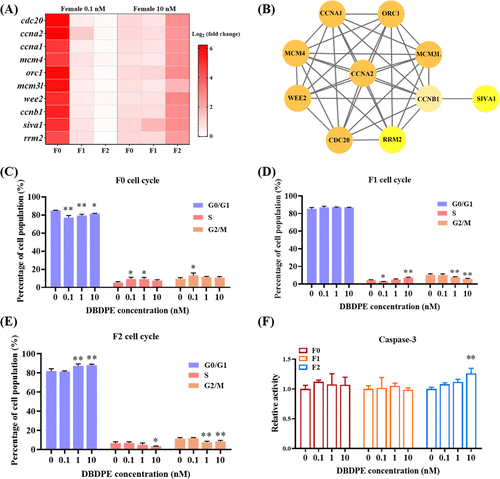
Effect of DBDPE exposure on the cell cycle and apoptosis in female zebrafish. (A) Transcription of genes related to cell cycle and apoptosis; (B) protein interactive network; (C) percentage of F0 cells in different phases; (D) percentage of F1 cells in different phases; (E) percentage of F2 cells in different phases; (F) relative activity of caspase-3 in different generation. Data are expressed as mean ± SEM of three replicate samples. *P < 0.05 and **P < 0.01 indicate significant differences between exposure groups and corresponding control group. |
|
|

