FIGURE SUMMARY
Title

Adjudin improves beta cell maturation, hepatic glucose uptake and glucose homeostasis

Authors
Ren, L., Charbord, J., Chu, L., Kemas, A.M., Bertuzzi, M., Mi, J., Xing, C., Lauschke, V.M., Andersson, O.
Source
Full text @ Diabetologia

Adjudin improves the function of regenerated beta cells in zebrafish. (a) The z score of bioluminescence during beta cell regeneration. Tg(ins:NLuc);Tg(ins:Flag-NTR) larvae were treated with DMSO or 5 µmol/l adjudin for 1 day after beta cell ablation, and bioluminescence was analysed at 5 dpf. Mann–Whitney test: ***p<0.001. n=24 larvae per treatment (3 larvae per data point). Data are presented as mean ± SEM. (b) qPCR analysis of ins expression in zebrafish larvae during beta cell regeneration. After beta cell ablation, Tg(ins:Flag-NTR) larvae were treated with DMSO or 5 µmol/l adjudin for 1 day from 4 to 5 dpf before being analysed by qPCR. Mann–Whitney test: *p<0.05. n=80 larvae per treatment (5–12 larvae per data point). Data are presented as mean ± SEM. (c) Free glucose levels in zebrafish larvae during beta cell regeneration. Tg(ins:CFP-NTR) larvae were treated with DMSO or 5 µmol/l adjudin for 2 days after beta cell ablation, and free glucose levels were analysed at 6 dpf. Mann–Whitney test: *p<0.05. n=12 larvae per treatment. Data are presented as mean ± SEM. (d) Maximum projections of primary islets in zebrafish during beta cell regeneration. Tg(ins:H2BGFP);Tg(ins:Flag-NTR) larvae were treated with DMSO or 5 µmol/l adjudin for 2 days after beta cell ablation, and subsequently fixed at 6 dpf for analysis. Scale bar, 10 μm. (e) Quantification of total number of regenerated beta cells in (d). Mann–Whitney test. n=27 larvae (DMSO), n=33 larvae (adjudin). Data are presented as mean ± SEM. (fi) Representative images from live calcium recording of islets before (f and h) and after the addition of 200 mmol/l glucose to the E3 medium (g and i). Beta cells expressing H2BmCherry are shown in red and the calcium signal in green. Images with merged channels are shown in (f, g, h, i), single red channels are shown in (f’, g’, h’, i’), and single green channels are shown in (f’’, g’’, h’’, I’’). Tg(ins:GCaMP6s);Tg(ins:H2BmCherry);Tg(ins:Flag-NTR) zebrafish larvae were treated with DMSO or 5 µmol/l adjudin for 1 day after beta cell ablation from 3 to 4 dpf, and imaged at 5 dpf. Scale bar, 10 µm. (j) Quantification of relative GCaMP intensity in beta cells at baseline (f and h). Mann–Whitney test: ***p<0.001. n=20 cells from four larvae (DMSO), n=22 cells from four larvae (adjudin). (k) Calcium activity indicated by normalised fluorescence over time in regenerated beta cells. Each line represents one cell. The addition of 200 mmol/l glucose is indicated by the white dashed line. Tg(ins:GCaMP6s);Tg(ins:H2BmCherry);Tg(ins:Flag-NTR) zebrafish larvae were treated with DMSO or 5 µmol/l adjudin for 1 day after beta cell ablation from 3 to 4 dpf, and had calcium signal recorded at 5 dpf. n=6 cells per treatment. (l) Quantification of percentage of beta cells that had calcium response to glucose. Tg(ins:GCaMP6s);Tg(ins:H2BmCherry);Tg(ins:Flag-NTR) zebrafish larvae were treated with DMSO or 5 µmol/l adjudin for 1 day after beta cell ablation from 3 to 4 dpf, and imaged at 5 dpf. Mann–Whitney test: *p<0.05. n=7 larvae per treatment. Data are presented as mean ± SEM. ΔF/F0, signal-to-baseline ratio; ΔF, deviation from the baseline; F0, basal fluorescence

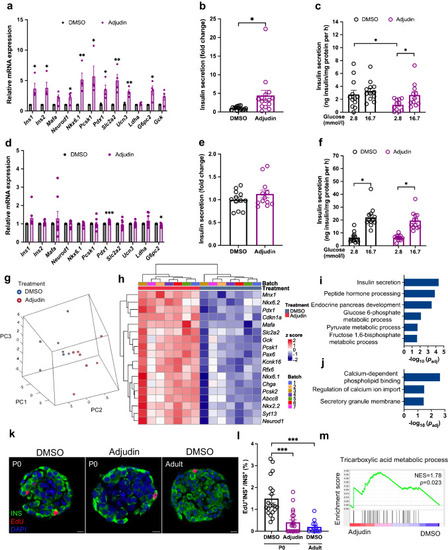
Adjudin improves the function of neonatal mouse islets. (a) qPCR analysis of the expression of beta cell maturation markers in P0 islets. P0 islets were cultured in medium containing 11 mmol/l glucose and treated with DMSO or 10 µmol/l adjudin for 1 day before qPCR. Student’s t test: *p<0.05, **p<0.01 vs DMSO. n=4 per treatment. Data are presented as mean ± SEM. (b) Accumulated insulin secretion by P0 islets. P0 islets were cultured in medium containing 11 mmol/l glucose and treated with DMSO or 10 µmol/l adjudin for 1 day. Culture medium was collected at the end of the treatment to analyse insulin levels. Student’s t test: *p<0.05. n=15 per treatment. Data are presented as mean ± SEM. (c) GSIS of P0 islets. P0 islets were cultured in medium containing 11 mmol/l glucose and treated with DMSO or 10 µmol/l adjudin for 1 day before GSIS. Student’s t test: *p<0.05. n=12 (DMSO), n=11 (adjudin). Data are presented as mean ± SEM. (d) qPCR analyses of the expression of beta cell maturation markers in adult islets. Adult islets were cultured in medium containing 11 mmol/l glucose and treated with DMSO or 10 µmol/l adjudin for 1 day before qPCR. Student’s t test: *p<0.05, ***p<0.001 vs DMSO. n=8 per treatment. Data are presented as mean ± SEM. (e) Accumulated insulin secretion by adult islets. Adult islets were cultured in medium containing 11 mmol/l glucose and treated with DMSO or 10 µmol/l adjudin for 1 day. Culture medium was collected at the end of the treatment to analyse insulin levels. Student’s t test. n=12 per treatment. Data are presented as mean ± SEM. (f) GSIS of adult islets. Adult islets were cultured in medium containing 11 mmol/l glucose and treated with DMSO or 10 µmol/l adjudin for 1 day before GSIS. Student’s t test: *p<0.05. n=12 per treatment. Data are presented as mean ± SEM. (g) 3D PCA plot for P0 islets. (h) Heatmap of significantly upregulated genes related to beta cell function in P0 islets after adjudin treatment, the scale represents z score. (i, j) GO terms associated with upregulated genes after adjudin treatment in P0 islets. (i) GO terms related to beta cell development and function and glucose metabolism. (j) GO terms related to downstream signalling of GSIS. (k) Representative immunofluorescence images from whole mount staining of mouse islets to assess proliferation. Islets were cultured in medium containing 11 mmol/l glucose and treated with DMSO or 10 µmol/l adjudin for 1 day. A final concentration of 20 µmol/l EdU was used for 2 h of incubation at the end of the treatment. Scale bar, 10 µm. (l) Quantification of percentage of proliferative beta cells in (k). One-way ANOVA with Tukey’s multiple comparisons test: ***p<0.001. n=20 (P0, DMSO), n=21 (P0, adjudin), n=12 (adult, DMSO). Data are presented as mean ± SEM. (m) GSEA plot showing gene sets related to ‘tricarboxylic acid metabolic process’. INS, insulin; NES, normalised enrichment score; PC1, principal component 1; PC2, principal component 2; PC3, principal component 3

Adjudin improves the function of islets from db/db mice. (a) qPCR analysis of the expression of beta cell maturation markers in db/db islets. The db/db islets were cultured in medium containing 11 mmol/l glucose and treated with DMSO or 10 µmol/l adjudin for 1 day before qPCR. Student’s t test: *p<0.05, **p<0.01 vs DMSO. n=10 per treatment. Data are presented as mean ± SEM. (b) Accumulated insulin secretion by db/db islets. The db/db islets were cultured in medium containing 11 mmol/l glucose and treated with DMSO or 10 µmol/l adjudin for 1 day. Culture medium was collected at the end of the treatment to analyse insulin levels. Student’s t test: ***p<0.001. n=9 per treatment. Data are presented as mean ± SEM. (c) PCA plot for db/db islets. The inside and outside dashed lines indicate 95% and 98% CI. (d) Heatmap of significantly upregulated genes related to beta cell function in db/db islets after adjudin treatment, the scale represents z score. (e) Heatmap of beta cell disallowed genes in db/db islets after adjudin treatment, the scale represents z score. *Significantly regulated genes, p<0.05. (fh) GO terms associated with upregulated genes after adjudin treatment in db/db islets. (f) GO terms related to beta cell development and function. (g) GO terms related to membrane ion channels. (h) GO terms related to exocytosis. PC1, principal component 1; PC2, principal component 2

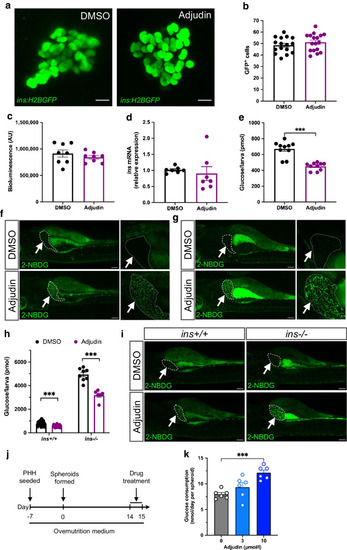
Adjudin stimulates glucose uptake in the zebrafish liver and in human liver spheroids. (a) Maximum projections of primary islets in zebrafish larvae in the basal state (i.e. in the absence of beta cell ablation). Tg(ins:H2BGFP) larvae were treated with DMSO or 5 µmol/l adjudin for 2 days and fixed at 6 dpf for analysis. Scale bar, 10 μm. (b) Quantification of total number of beta cells in zebrafish larvae in the basal state (a). Mann–Whitney test. n=16 larvae (DMSO), n=17 larvae (adjudin). Data are presented as mean ± SEM. (c) Bioluminescence of zebrafish larvae in the basal state. Tg(ins:NLuc) larvae were treated with DMSO or 5 µmol/l adjudin for 1 day, and the luciferase assay was performed at 5 dpf. Mann–Whitney test. n=8 larvae per treatment. Data are presented as mean ± SEM. (d) qPCR analysis of ins expression in zebrafish larvae in the basal state. Wild-type zebrafish larvae were treated with DMSO or 5 µmol/l adjudin for 1 day before being analysed by qPCR at 5 dpf. Mann–Whitney test. n=65 larvae per treatment (5–12 larvae per data point). Data are presented as mean ± SEM. (e) Free glucose levels in zebrafish larvae in the basal state. Zebrafish larvae were treated with DMSO or 5 µmol/l adjudin for 2 days, and the free glucose levels were analysed at 6 dpf. Mann–Whitney test. ***p<0.001. n=10 larvae per treatment. Data are presented as mean ± SEM. (f) Glucose uptake indicated by 2-NBDG. Zebrafish larvae were pretreated with 5% glucose for 1 day, followed by treatment with DMSO or 5 µmol/l adjudin for 1 day, then 20 µmol/l 2-NBDG was added at the end of the treatment and the fluorescence analysed at 6 dpf. Livers of the larvae are outlined by white dashed lines and pointed to by white arrows. Scale bar, 100 µm (left panel); scale bar, 10 µm (right panel). (g) Glucose uptake indicated by 2-NBDG in zebrafish during beta cell regeneration. Tg(ins:Flag-NTR) zebrafish larvae were treated with DMSO or 5 µmol/l adjudin for 1 day following beta cell ablation, then 20 µmol/l 2-NBDG was added at the end of the treatment and the fluorescence signals were analysed at 5 dpf. Livers of the larvae are outlined by white dashed lines and pointed to by white arrows. Scale bar, 100 µm (left panel); scale bar, 10 µm (right panel). (h) Free glucose levels in ins +/+ and ins −/− larvae. ins +/− zebrafish were incrossed to generate ins +/+ and ins −/− larvae. The larvae were treated with DMSO or 5 µmol/l adjudin for 2 days from 3 to 5 dpf prior to analysis of free glucose levels. Mann–Whitney test: ***p<0.001. n=19 larvae (ins +/+, DMSO), n=19 larvae (ins +/+, adjudin), n=8 larvae (ins −/−, DMSO), n=6 larvae (ins −/−, adjudin). Data are presented as mean ± SEM. (i) Glucose uptake indicated by 2-NBDG in ins+/+ (left panel) and ins−/− (right panel) zebrafish. The zebrafish larvae were treated with DMSO or 5 µmol/l adjudin for 1 day, then 20 µmol/l 2-NBDG was added at the end of the treatment and the fluorescence signals were analysed at 5 dpf. Livers of the larvae are outlined by white dashed lines and pointed to by white arrows. Scale bar, 100 µm. (j) Schematic showing the timeline of experiments using PHHs. The PHHs were seeded to form spheroids and conditioned in overnutrition medium for 3 weeks to induce insulin resistance prior to treatment with DMSO, 3 µmol/l adjudin or 10 µmol/l adjudin. The glucose level in the medium was measured before and after the treatment. (k) Glucose consumption of the PHH spheroids treated as described in (j). One-way ANOVA followed by Dunnett’s multiple comparisons test: ***p<0.001. n=6 independent biological replicates per treatment. Data are presented as mean ± SEM. AU, arbitrary units

Adjudin improves glucose homeostasis in db/db mice. (a) Schematic of the in vivo study using 8-week-old male db/db mice. The mice received intraperitoneal injections of vehicle (n=6) or 50 mg/kg adjudin (n=4) every other day for 3 weeks. Body weight and nonfasting glucose were measured weekly. IPGTT and histological examination were performed at the end of the treatment. (b) Weekly body weight of the db/db mice. Student’s t test. Data are presented as mean ± SEM. (c) Weekly nonfasting blood glucose of the db/db mice. Student’s t test: *p<0.05 vs vehicle. Data are presented as mean ± SEM. (d) IPGTT. Student’s t test: *p<0.05, **p<0.01 vs vehicle. Data are presented as mean ± SEM. (e) AUC of the IPGTT. Student’s t test: **p<0.01. Data are presented as mean ± SEM. (f) Intraperitoneal glucose stimulated insulin secretion (IPGSIS). Blood insulin levels in the IPGTT experiment. Student’s t test. Data are presented as mean ± SEM. (g) AUC curve of the IPGSIS. Student’s t test. Data are presented as mean ± SEM. (h) Pancreatic beta cell mass in vehicle- and adjudin-treated db/db mice. Student’s t test. Data are presented as mean ± SEM. (i) Immunofluorescence staining of insulin (INS), NKX6.1 and PDX1 in pancreas from vehicle- and adjudin-treated db/db mice. Scale bar, 10 µm. (j) Quantification of the percentage of insulin-positive cells expressing NKX6.1 per islet. Student’s t test. *p<0.05. n=101 islets (vehicle), n=67 islets (adjudin). Data are presented as mean ± SEM. (k) Quantification of the percentage of insulin-positive cells expressing PDX1 per islet. Student’s t test. n=90 islets (vehicle), n=65 islets (adjudin). Data are presented as mean ± SEM

Acknowledgments
This image is the copyrighted work of the attributed author or publisher, and ZFIN has permission only to display this image to its users. Additional permissions should be obtained from the applicable author or publisher of the image. Full text @ Diabetologia