IMAGE

Fig. 3

ID
ZDB-IMAGE-231211-59
Source
Figures for Ren et al., 2023
Image
Figure Caption

Fig. 3

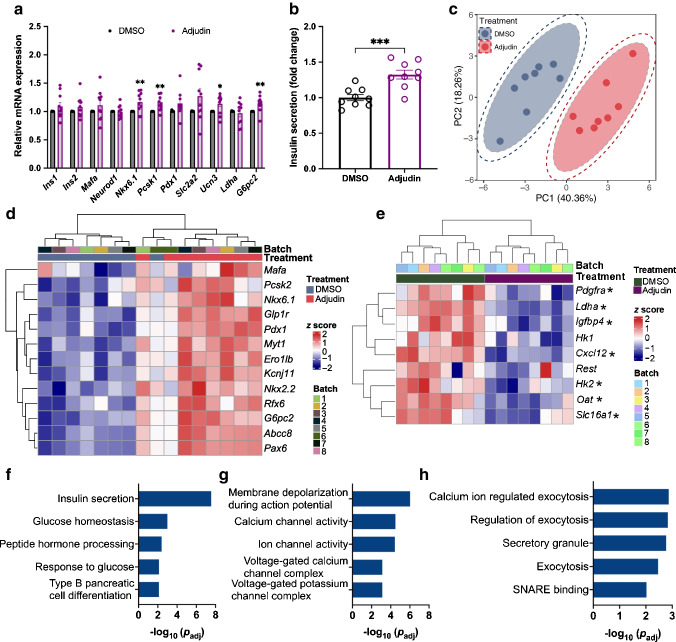
Adjudin improves the function of islets from db/db mice. (a) qPCR analysis of the expression of beta cell maturation markers in db/db islets. The db/db islets were cultured in medium containing 11 mmol/l glucose and treated with DMSO or 10 µmol/l adjudin for 1 day before qPCR. Student’s t test: *p<0.05, **p<0.01 vs DMSO. n=10 per treatment. Data are presented as mean ± SEM. (b) Accumulated insulin secretion by db/db islets. The db/db islets were cultured in medium containing 11 mmol/l glucose and treated with DMSO or 10 µmol/l adjudin for 1 day. Culture medium was collected at the end of the treatment to analyse insulin levels. Student’s t test: ***p<0.001. n=9 per treatment. Data are presented as mean ± SEM. (c) PCA plot for db/db islets. The inside and outside dashed lines indicate 95% and 98% CI. (d) Heatmap of significantly upregulated genes related to beta cell function in db/db islets after adjudin treatment, the scale represents z score. (e) Heatmap of beta cell disallowed genes in db/db islets after adjudin treatment, the scale represents z score. *Significantly regulated genes, p<0.05. (fh) GO terms associated with upregulated genes after adjudin treatment in db/db islets. (f) GO terms related to beta cell development and function. (g) GO terms related to membrane ion channels. (h) GO terms related to exocytosis. PC1, principal component 1; PC2, principal component 2

Acknowledgments
This image is the copyrighted work of the attributed author or publisher, and ZFIN has permission only to display this image to its users. Additional permissions should be obtained from the applicable author or publisher of the image. Full text @ Diabetologia