
- Title
-
Physiology-informed toxicokinetic model for the zebrafish embryo test developed for bisphenols
- Authors
- Chelcea, I., Vogs, C., Hamers, T., Koekkoek, J., Legradi, J., Sapounidou, M., Örn, S., Andersson, P.L.
- Source
- Full text @ Chemosphere

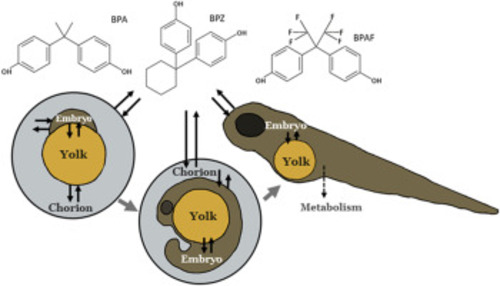
Structure of the TK model represented for three developmental stages: i) between 0% until 100% epiboly (around 10 hpf) ii) between around 10 hpf until hatching (60 hpf), and iii) > 60 hpf hatching. Arrows represent mass flow of compound between compartments. |

Model prediction of internal zebrafish embryo (ZFE) amounts compared with measured amounts (dots) for BPZ (A), BPA (B) and BPAF (C) from current study at 4–120 hpf exposure. |

Observed and predicted amount (nmol) of compound per ZFE (embryo body, yolk and chorion) for BPA (A), BPAF, BPF, TBBPA (B), BPS and BP-2 (C). Solid line represents 1:1 correlation and dotted lines represent the 2-fold (black) and 5-fold- (gray) errors. R2 was calculated for each graph. Note that all data presented in this Figure was not used in model calibration. |
|