
Image
|
Figure Caption
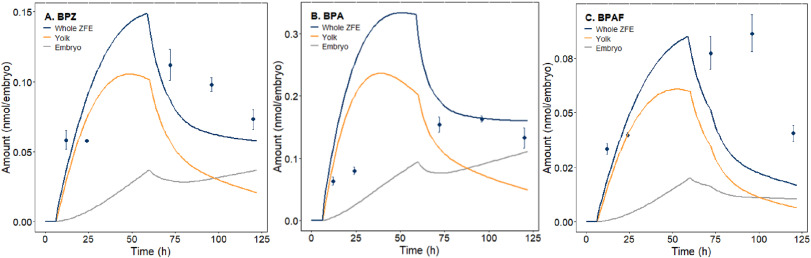
Fig. 2 Model prediction of internal zebrafish embryo (ZFE) amounts compared with measured amounts (dots) for BPZ (A), BPA (B) and BPAF (C) from current study at 4–120 hpf exposure.
Acknowledgments
This image is the copyrighted work of the attributed author or publisher, and
ZFIN has permission only to display this image to its users.
Additional permissions should be obtained from the applicable author or publisher of the image.
Full text @ Chemosphere