FIGURE SUMMARY
Title

Multivalent insulin receptor activation using insulin-DNA origami nanostructures

Authors
Spratt, J., Dias, J.M., Kolonelou, C., Kiriako, G., Engström, E., Petrova, E., Karampelias, C., Cervenka, I., Papanicolaou, N., Lentini, A., Reinius, B., Andersson, O., Ambrosetti, E., Ruas, J.L., Teixeira, A.I.
Source
Full text @ Nat Nanotechnol

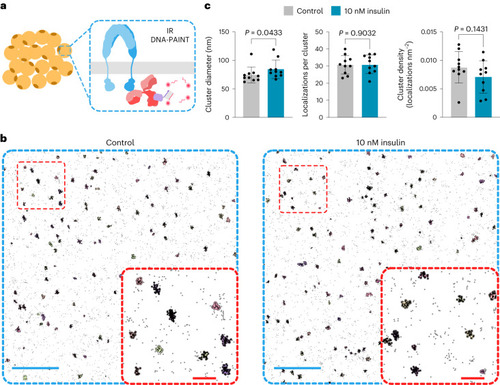
IRs are organized in nanoclusters at the cell membrane.

a, Schematic of DNA-PAINT used to image IRs (blue) using antibodies (red) targeting the intracellular kinase domain in adipocyte cultures. b, Cluster outlines derived from DNA-PAINT of IRs at the cell membrane of adipocytes treated with PBS (control) or with 10 nM of insulin for 10 min. The insets show the magnified regions highlighting the identified clusters. Scale bars, 1 µm (blue); 200 nm (red, inset). c, Characterization of IR clusters in control and insulin-treated adipocytes. Data are presented as mean ± standard deviation (s.d.), n = 10 cells per condition. The P values are determined by a two-tailed Mann–Whitney test.

Source data

Insulin NanoRods with programmable insulin configurations.

a, Representation of the DNA origami NanoRod. The red circles correspond to the positions of protruding DNA strands at programmable positions along one of its faces used for hybridization to INS-DNA. b, Overview of the method used to conjugate a single azide-modified ssDNA oligonucleotide to the B29 lysine of insulin (green) using a DBCO-sulfo-NHS crosslinker (not drawn to scale). c, Agarose gel electrophoresis of the scaffold strand and of insulin NanoRods with 0 (NR), 1 (NR-1), 2 (NR-2), 4 (NR-4), 7 (NR-7) and 15 (NR-15) insulin molecules. The image is representative of three independent experiments. d, Analysis of the indicated insulin NanoRods by dynamic light scattering. e, Schematic of DNA-PAINT used to image INS-DNA bound to the NanoRods. Distribution of the occupancy of insulin on the indicated insulin NanoRods. The values presented under the images correspond to mean ± s.d. Scale bar, 50 nm.

Source data

Valency of insulin on NanoRods determines the residence time of IR binding.

a, Schematic of the SPR assay: biotinylated ECD-IR was immobilized onto a streptavidin-coated SPR surface followed by incubation with INS-DNA or insulin NanoRods. b, SPR traces showing the binding of INS-DNA and of the indicated insulin NanoRods to the ECD-IR. KD was calculated from the curves obtained from INS-DNA, NR-2, NR-4 and NR-7. RU, resonance units. c, Residence time (t1/2) of the insulin NanoRods and INS-DNA on ECD-IR, calculated from the SPR binding curves. The values shown are from one representative experiment out of two independent experiments.

Source data

Valency and spacing of insulin on NanoRods determine IR pathway activation.

a, Schematic of the NanoRods used in experiments (bg and ln). bd, Western blot analysis (b) and the quantification of phosphorylated IR (pIR) (c) and phosphorylated AKT (pAKT) (d) levels in adipocytes treated with medium as controls (Ctrl) or with the indicated insulin NanoRods for 10 min. The total insulin concentration was kept constant at 10 nM. The values are presented as mean ± standard error of the mean (s.e.m.); n = 5 (NR-15) or n = 6 (remaining conditions) biologically independent samples. eg, Western blot analysis (e) and the quantification of pIR (f) and pAKT (g) levels of adipocytes treated with medium (Ctrl) or with the indicated insulin NanoRods for 10 min. The total concentration of NanoRods was kept constant at 1 nM. The values are presented as mean ± s.e.m.; n = 4 biologically independent samples. h, Schematic of the NanoRods used in experiments (ik). ik, Western blot analysis (i) and the quantification of pIR (j) and pAKT (k) levels of adipocytes treated with medium (Ctrl) or with the indicated insulin NanoRods for 10 min. The total insulin concentration was kept constant at 10 nM. The values are presented as mean ± s.e.m.; n = 3 biologically independent samples. c,d,f,g,j,k, P values determined by one-way ANOVA followed by Dunnett’s multiple comparisons test. l, Quantification of pIR levels in adipocytes treated with increasing total insulin concentrations of NR-4, NR-7, NR-15 and unmodified insulin for 10 min. Data are plotted as normalized intensities relative to their highest and lowest values, for each condition. m, Quantification of pIR levels in adipocytes treated with 50 nM total insulin of NR-4, NR-7, NR-15 and unmodified insulin for 10 min. P values determined by one-way ANOVA followed by Dunnett’s multiple comparisons test. n, Quantification of pIR levels in adipocytes treated with 10 nM total insulin of NR-4, NR-7, NR-15 and unmodified insulin for 5, 10, 15, 30 and 60 min. Data are plotted as normalized intensities relative to their highest and lowest values, for each condition. The values in ln are presented as mean ± s.e.m. for n = 3 biologically independent samples. The unmodified insulin used was purified similar to the NanoRods.

Source data

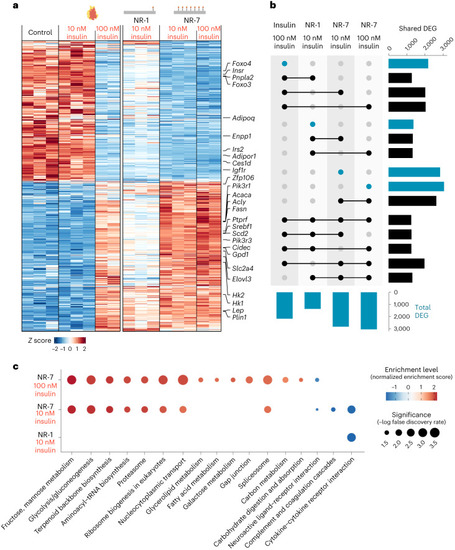
Valency of insulin on NanoRods modulates transcriptional responses.

a, Heat map of DEG (P ≤ 0.001; log2fold change, ±0.58) in adipocyte cultures treated with medium (Control), insulin at 10 or 100 nM, NR-1 at 10 nM of insulin and NR-7 at 10 nM or 100 nM of insulin for 4 h. b, UpSet plot visualizing the total number (blue bars) and shared (black bars) DEG across all the conditions for which DEG were detected. c, GSEA with false-discovery rate adjustment for KEGG pathways enriched (P ≤ 0.05) in cells treated with NR-1 at 10 nM insulin or NR-7 at 10 and 100 nM insulin. The highlighted categories indicate pathways associated with insulin metabolism. INS denotes insulin.

Source data

Valency of insulin on NanoRods determines their capacity to lower free glucose in β-cell-ablated zebrafish larvae.

a, Schematic of the zebrafish model, which expresses the enzyme nitroreductase (NTR) under the control of the insulin promoter and converts the MTZ compound into a toxic byproduct that ablates β-cells. Larvae were treated with MTZ at 2 dpf for 24 h. Double-transgenic larvae, Tg(ins:CFP-NTR);Tg(ins:Kaede), were used to visualize β-cells with the fluorescent protein Kaede. NRK-PEG, NR-1K-PEG or NR-7K-PEG was intravenously injected into larvae at 3 dpf and the measurements of free glucose levels were taken 4 hpi. b, Confocal microscopy imaging of the Kaede fluorescent protein expressed in pancreatic β-cells in the indicated conditions. Scale bar, 10 µm. c, Bar plots of the quantifications of Kaede+ β-cells. Two independent experiments were performed; one representative experiment is shown where each dot corresponds to a larva. The values are presented as mean ± s.e.m. n = 8 (non-ablated, ablated non-injected), n = 7 (NRK-PEG, NR-1K-PEG), n = 10 (NR-7K-PEG). The P values are determined by a Kruskal–Wallis test with Dunn’s multiple comparisons test. d, Bar plots of free glucose levels in NR-1K-PEG- and NR-7K-PEG-treated larvae relative to NRK-PEG-treated larvae. The values are presented as mean ± s.d. n = 3 independent experiments (Extended Data Fig. 9e). The P values are determined by one-way ANOVA with Tukey’s multiple comparisons test.

Source data

Acknowledgments
This image is the copyrighted work of the attributed author or publisher, and ZFIN has permission only to display this image to its users. Additional permissions should be obtained from the applicable author or publisher of the image. Full text @ Nat Nanotechnol