FIGURE SUMMARY
Title

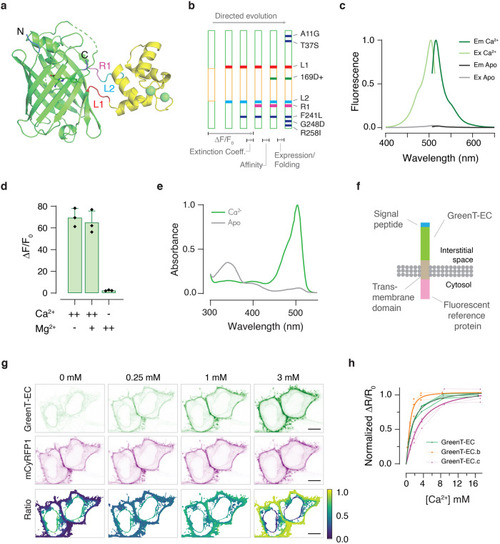
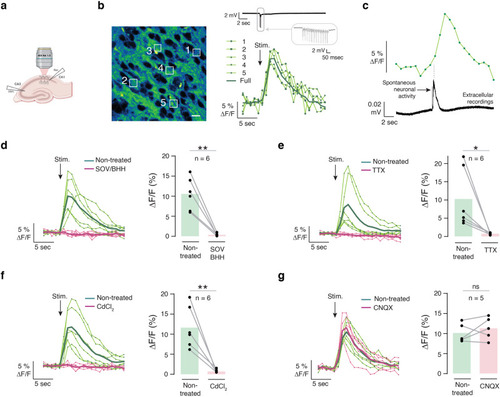
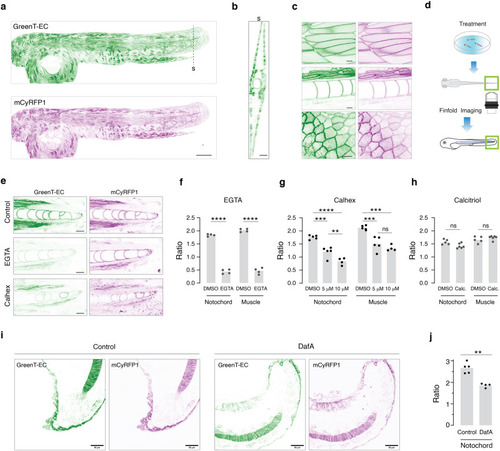
Fluorescent sensors for imaging of interstitial calcium

Authors
Valiente-Gabioud, A.A., Garteizgogeascoa Suñer, I., Idziak, A., Fabritius, A., Basquin, J., Angibaud, J., Nägerl, U.V., Singh, S.P., Griesbeck, O.
Source
Full text @ Nat. Commun.

Development of GreenT-ECs.

a Crystal structure of a calcium-bound GreenT-EC intermediate variant (NRS 1.2) generated during the process of directed evolution. The minimal calcium-binding domain derived from Troponin C (yellow) was inserted into the fluorescent protein mNeonGreen (green). Spheres (green) indicate two bound calcium ions. Linkers (L1 and L2), as well as a particularly crucial region (R1) for engineering are highlighted. N and C mark the N-and C-terminus of the protein. b Iterative cycles of directed evolution were performed to optimize GreenT-ECs (green: mNeonGreen moiety, yellow: TnC minimal domain). L1, L2: mutated linker amino acids. R1: stretch of three amino acids comprising residues 225–227 reaching into the ß-barrel. Together with linker mutations, this sensitive area fundamentally affected fluorescence change, brightness and off-kinetic of variants. Individual amino acid changes affecting folding and expression are indicated (blue). c Excitation and emission spectrum of GreenT-EC at 0 mM (gray) and 30 mM (green) Ca2+. d Maximal fluorescence change of GreenT-EC in response to calcium and/or magnesium (++ is 100 mM, + is 5 mM, - is 0 mM, n = 3 technical replicates for one protein production). e Absorbance changes of GreenT-ECs in the absence (grey) and presence (green) of calcium. The major absorbance peak maximum was at 504 nm. Minor absorbance peaks at 350 nm and 400 nm corresponded to dark forms of the chromophore. f Cell surface display of GreenT-EC. An effective way consisted of fusing an N-terminal signal peptide to GreenT-EC and a C-terminal membrane anchoring domain (from PDGF receptor). The fluorescent reference protein mCyRFP1 was added to the C-terminus (intracellular). g Representative images of HeLa cells expressing surface-delivered GreenT-ECs when exposed to increasing calcium concentrations. Ratiometric (GreenT-EC/mCyRFP1) images are presented in the bottom panel. Scale bar, 10 μm. h GreenT-EC/mCyRFP1 titrations on the surface of HEK293T cells. Individual titration experiments are plotted with lines and symbols (n = 3 biological replicates, with a total number of analyzed cells of 30, 29 and 26 for GreenT-EC, GreenT-EC.b and GreenT-EC.c, respectively). Fitted curves for each variant are included with thicker lines. Source data are provided in the Source Data file.

In vitro spectroscopy of GreenT-ECs.

a In vitro affinity titration fitted curves of recombinant purified GreenT-EC and two variants with higher (GreenT-EC.b) and lower (GreenT-EC.c) affinity. b Off-rate kinetics of the three variants of the sensor. The proteins were prepared in MOPS 30 mM, KCl 100 mM, Mg 2.5 mM, Ca2+ 100 mM and rapidly mixed with BAPTA 200 mM. c Fitted curves of pka measurements for the three sensors studied in this article. Measurements were obtained by preparing pH solutions in MOPS/MES containing 100 mM Ca2+. d On-rate kinetics of GreenT-EC (green), GreenT-EC.b (blue) and lower affinity GreenT-EC.c (yellow) were measured by rapidly mixing solutions of protein in MOPS 30 mM, KCl 100 mM, Mg 1 mM with MOPS 30 mM, KCl 100 mM, Mg2+ 1 mM containing increasing concentration of Ca2+. e A double exponential was used for the fittings for each variant and the obtained Kon values were plotted against the calcium concentration. Kobs1 corresponds to the first step of the rate, representing 25–30% of the total response. Kobs2 corresponds to the slower process and accounts for the higher percentage of the total response. In all cases, a decrease in the Kobs is observed at increasing concentrations of calcium. This suggests a mechanism by which there is an equilibrium between at least two species of the sensor, and only one can progress to a fluorescent species upon calcium binding. Technical replicates of proteins produced and purified on the same day were used for all fittings. Source data are provided in the Source Data file.

Flow cytometry analysis of GreenT-EC cell surface exposure.

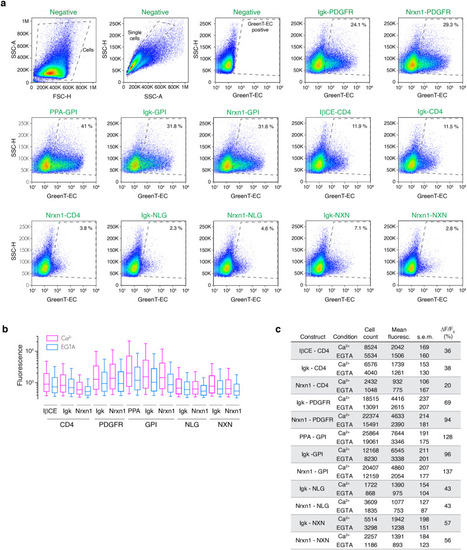
Twelve combinations of export signal peptides and transmembrane/anchoring domains were used to target GreenT-EC to the surface of the cell. HeLa cells were transiently transfected with each construct and analyzed using flow cytometry. a Density plots of the negative control (non-transfected) indicating the gating strategy for selecting GreenT-EC positive single cells (indicated in slashed lines). Both the negative and the rest of the constructs displayed were resuspended in a MOPS buffer containing 3 mM CaCl2. b The fluorescence of GreenT-EC positive gated cells was further analyzed before and after the addition of EGTA (final concentration of 7.5 mM). Box-plots 90-10% are presented (whiskers are 90 and 10 percentiles, boxes are 75 and 25 percentiles and the center line correspond to the median). c Summary table compiling the main parameters of the experiment: Number of cells gated as GreenT-EC positive in each condition (n=cell count), mean fluorescence of GreenT-EC (mean fluoresce.), standard error of the mean (s.e.m) and the response calculated between the mean GreenT-EC fluorescence values before and after the addition of EGTA (ΔF/F0). Source data are provided in the Source Data file.

Validation of GreenT-EC in rodent hippocampus.

a Scheme of surface targeted GreenT-EC (green) by means of an N-terminal signal peptide (blue) and a C-terminal GPI anchor (brown). b STED images of AAV-GreenT-EC infected neurons in hippocampal area CA1 of organotypic slice cultures (7 days postinfection). Scale bars: 10 μm, 5 μm, 2 μm, for left, middle and right panel, respectively. c Application of calcium solution to brain slices via micropipettes. d Time series representative images showing fluorescence changes in transfected hippocampal organotypic slices when exposed to 1.5 mM and 8 mM extracellular calcium. Scale bar 10 μm. e Dynamic GreenT-EC fluorescence changes upon repetitive brief (500 ms each) high-calcium (8 mM) solution puffs from baseline levels of 1.5 mM. Orange lines indicate the timing of the puffs. f Averaged response curves to the calcium injections from experiment e. g Calibration of GreenT-EC signals in hippocampal slices. The response was calculated using 0.5 mM Ca2+ as the basal fluorescence value. Each gray line corresponds to a different slice (n = 6 biological replicates). The orange line represents the mean value at each calcium concentration (the error bar corresponds to the s.e.m.). h Summary table of mean responses and s.e.m. obtained in the calibration experiment presented in g. Source data are provided in the Source Data file.

Activity evoked hippocampal CA1 GreenT-EC signals.

a Electrical stimulation of the hippocampal Schaffer collateral pathway was used to elicit GreenT-EC responses monitored by two-photon microscopy. b Representative example of GreenT-EC expressing hippocampal organotypic slice (left) and the fluorescence traces upon electrical stimulation (right). White ROIs shown in the image correspond to individual traces. The dark-green trace (Full) correspond to a ROI covering the whole image. Scale bar 10 μm. c GreenT-EC fluorescence responses (top) upon spontaneous neuronal activity recorded extracellularly (bottom). d Activity evoked hippocampal CA1 GreenT-EC signals and their inhibition by a combination of sodium ortho-vanadate (SOV, 5 µM) and benzamyl hydrochlorate hydrate (BHH, 50 µM) at 30 min after drug infusion (n = 6, p = 0.0013). eg Activity evoked hippocampal CA1 GreenT-EC signals and their inhibition after 30 min application of TTX (n = 6, p = 0.0362), CdCl2 (n = 6, p = 0.0038) or CNQX (n = 6, p = 0.3976). In all cases, n correspond to biological replicates and a parametric two-tailed paired t-test was used to evaluate the differences among control and treated groups (* p < 0.05, ** p < 0.01). Source data are provided in the Source Data file.

In vivo imaging of calcium homeostasis in transgenic zebrafish.

a Maximum intensity Z-projection of a confocal stack from a 2 dpf transgenic zebrafish expressing mCyRFP1-referenced GreenT-EC. Scale bar, 200 μm. b Representative orthogonal view of the animal model in the fin fold. Scale bar, 20 μm. c Representative images of skeletal muscle cells (upper panel), vacuolar cells of the notochord and ventral/dorsal muscle (middle panel) and epithelial cells (bottom panel) in the fin fold. Scale bar, 10 µm. d Experimental strategy used for imaging transgenic GreenT-EC zebrafish larvae. After acute or chronic treatment fish are mounted in low melting agarose and the posterior fin fold is imaged. e Confocal images of the fin fold of 4 dpf zebrafish larvae after various treatments. Top: fish larvae under control conditions. Middle: after 10 min treatment with EGTA (3 mM). Bottom: treatment with Calhex231 (10 µM) from 2 dpf to 4 dpf. Scale bar, 20 µm. f Quantification of the EGTA effect (n = 4) on interstitial calcium as GreenT-EC/mCyRFP1 ratio around notochord and dorsal/ventral muscle cells. g Effects of the CaSR inhibitor Calhex231 applied at 5 µM (n = 5) and 10 µM (n = 4) in E2 embryo medium containing 0.03 mM calcium for 48 h. Ratio values were compared with the control group (n = 5). h Effects of Calcitriol 2 µM (n = 6) treatment for 48 h on interstitial calcium around notochord and muscle compared to control animals (n = 5). i Confocal images of the fin fold of 1 dpf control zebrafish larvae (left) or treated with 12.5 µM DafadineA (DafA) (right) during 21 h. Scale bar, 50 μM. j Quantification of the DafA effect on interstitial calcium as GreenT-EC/mCyRFP1 ratio in the notochord (n = 5 for each group). In all experiments, n represents a biological replicate (fish). Two-tailed unpaired t-test were used to calculate the statistical significance between the control and treated groups (f,h,j). For multiple group analyses (g), One-way ANOVA followed by a Tukey multiple comparison test was performed (* p < 0.05, ** p < 0.01, *** p < 0.001 and **** p < 0.0001). Source data are provided in the Source Data file.

Acknowledgments
This image is the copyrighted work of the attributed author or publisher, and ZFIN has permission only to display this image to its users. Additional permissions should be obtained from the applicable author or publisher of the image. Full text @ Nat. Commun.