IMAGE

Fig. 1

ID
ZDB-IMAGE-231009-11
Source
Figures for Valiente-Gabioud et al., 2023
Image
Figure Caption

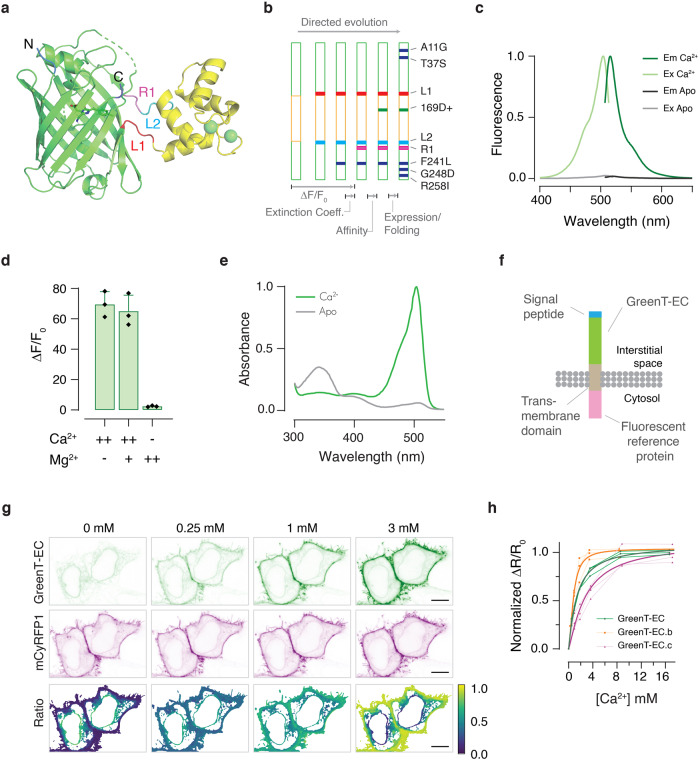
Fig. 1 Development of GreenT-ECs.

a Crystal structure of a calcium-bound GreenT-EC intermediate variant (NRS 1.2) generated during the process of directed evolution. The minimal calcium-binding domain derived from Troponin C (yellow) was inserted into the fluorescent protein mNeonGreen (green). Spheres (green) indicate two bound calcium ions. Linkers (L1 and L2), as well as a particularly crucial region (R1) for engineering are highlighted. N and C mark the N-and C-terminus of the protein. b Iterative cycles of directed evolution were performed to optimize GreenT-ECs (green: mNeonGreen moiety, yellow: TnC minimal domain). L1, L2: mutated linker amino acids. R1: stretch of three amino acids comprising residues 225–227 reaching into the ß-barrel. Together with linker mutations, this sensitive area fundamentally affected fluorescence change, brightness and off-kinetic of variants. Individual amino acid changes affecting folding and expression are indicated (blue). c Excitation and emission spectrum of GreenT-EC at 0 mM (gray) and 30 mM (green) Ca2+. d Maximal fluorescence change of GreenT-EC in response to calcium and/or magnesium (++ is 100 mM, + is 5 mM, - is 0 mM, n = 3 technical replicates for one protein production). e Absorbance changes of GreenT-ECs in the absence (grey) and presence (green) of calcium. The major absorbance peak maximum was at 504 nm. Minor absorbance peaks at 350 nm and 400 nm corresponded to dark forms of the chromophore. f Cell surface display of GreenT-EC. An effective way consisted of fusing an N-terminal signal peptide to GreenT-EC and a C-terminal membrane anchoring domain (from PDGF receptor). The fluorescent reference protein mCyRFP1 was added to the C-terminus (intracellular). g Representative images of HeLa cells expressing surface-delivered GreenT-ECs when exposed to increasing calcium concentrations. Ratiometric (GreenT-EC/mCyRFP1) images are presented in the bottom panel. Scale bar, 10 μm. h GreenT-EC/mCyRFP1 titrations on the surface of HEK293T cells. Individual titration experiments are plotted with lines and symbols (n = 3 biological replicates, with a total number of analyzed cells of 30, 29 and 26 for GreenT-EC, GreenT-EC.b and GreenT-EC.c, respectively). Fitted curves for each variant are included with thicker lines. Source data are provided in the Source Data file.

Acknowledgments
This image is the copyrighted work of the attributed author or publisher, and ZFIN has permission only to display this image to its users. Additional permissions should be obtained from the applicable author or publisher of the image. Full text @ Nat. Commun.