
- Title
-
rasa1-related arteriovenous malformation is driven by aberrant venous signalling
- Authors
- Greysson-Wong, J., Rode, R., Ryu, J.R., Chan, J.L., Davari, P., Rinker, K.D., Childs, S.J.
- Source
- Full text @ Development
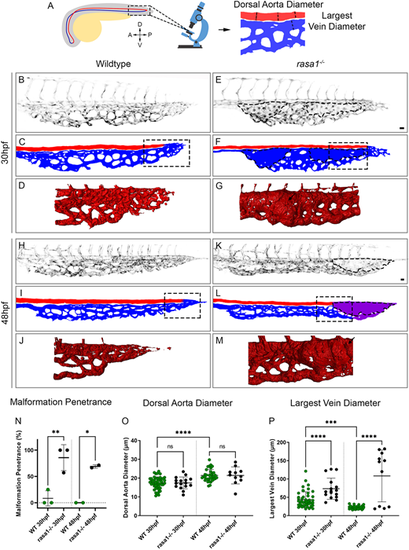
rasa1 mutants show vessel enlargement in the caudal venous plexus without affecting the dorsal aorta. (A) Schematic of the location where confocal images were taken of the caudal venous plexus (outlined). Schematic of how the dorsal aorta (DA) and largest vein diameter were measured. A, anterior; P, posterior; D, dorsal; V, ventral. (B,E,H,K) Confocal images of the caudal venous plexus of wild-type and rasa1 mutant endothelium (kdrl:EGFP, black). (C,F,I,L) Schematic of the vessels showing the dorsal aorta (red), caudal venous plexus (blue) and vessels of unknown arteriovenous identity (purple). (D,G,J,M) Simpleware was used on high-resolution confocal images to create 3D renderings of the flow return area where malformations develop in rasa1 mutants. Areas outlined in C,F,I,L indicate the approximate location of the 3D renderings from images of different embryos. (N-P) Quantification of confocal images of wild-type and rasa1 mutant embryos at 30 hpf and 48 hpf. (N) Penetrance of vessel enlargement (≥1.5× average largest wild-type vein diameter) at 30 hpf and 48 hpf (30 hpf: wild type, n=13; rasa1−/−, n=16; N=3 experiments, P=0.005; 48 hpf: wild type, n=10; rasa1−/−, n=10; N=2 experiments, P=0.024). (O) The average wild-type DA diameter was not significantly different from that in mutants at either timepoint (30 hpf: wild type, n=13, rasa1−/−, n=16; N=3 experiments, P>0.99; 48 hpf: wild type, n=12; rasa1−/−, n=11; N=3 experiments, P>0.99). (P) The largest vein at 30 hpf is larger in mutants and is further enlarged at 48 hpf (30 hpf: wild type, n=13; rasa1−/−, n=16; N=3 experiments, P=0.0018; 48 hpf: wild type, n=12; rasa1−/−, n=11; N=3 experiments, P<0.0001). Statistical analysis used a one-way ANOVA with Sidak's correction. Data are mean±s.d. Scale bars: 20 µm. |
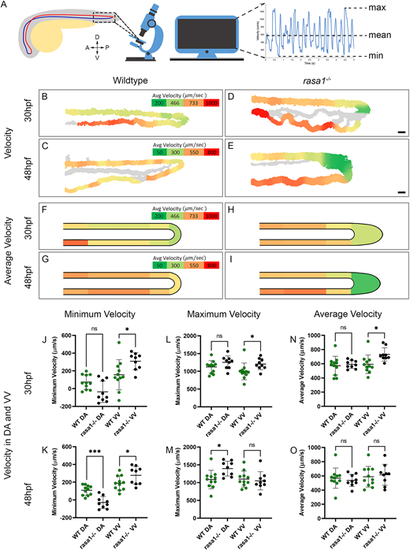
Blood flow velocity is affected by the vascular malformations in rasa1−/− embryos. (A) Diagram illustrating the areas where movies were captured and velocity metric calculation. (B-E) Velocity heatmaps of representative wild-type and rasa1 mutant embryos. (F-I) Mean velocity heatmaps of wild-type and rasa1 mutant embryos. (J-O) Quantification of minimum, maximum and mean velocities in wild types and rasa1 mutants at 30 hpf and 48 hpf (wild type 30 hpf and 48 hpf, n=11; rasa1−/− 30 hpf and 48 hpf, n=9). (J,K) Minimum velocity at 30 hpf and 48 hpf of wild type and rasa1 mutants in the DA and ventral vein (VV). (L,M) Maximum velocity at 30 hpf and 48 hpf of wild type and rasa1 mutants in the DA and VV. (N,O) Mean velocity at 30 hpf and 48 hpf of wild type and rasa1 mutants in the DA and VV. Statistical analysis was carried out using one-way ANOVA with Sidak's correction. Data are mean±s.d. Scale bars: 20 µm. |
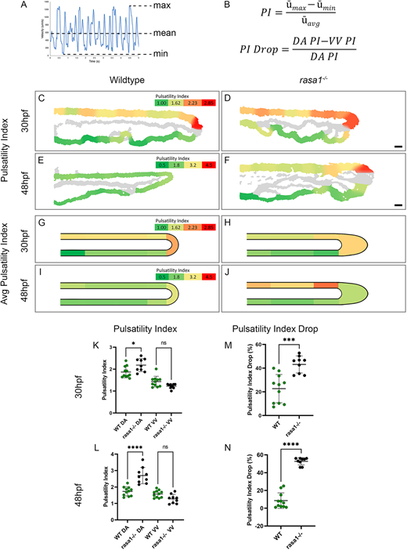
Blood flow pulsatility is affected by vascular lesions in rasa1 mutants. (A,B) Diagram and equations illustrating how the pulsatility index (PI) and PI drop were calculated. (C-F) PI heatmaps of representative wild-type and rasa1 mutant embryos. (G-J) Average PI heatmaps of wild-type and rasa1 mutant embryos. (K,L) PI at 30 hpf and 48 hpf, respectively, of wild types and rasa1 mutants in the dorsal aorta (DA) and ventral vein (VV). (M,N) PI drop at 30 hpf and 48 hpf, respectively, of wild type and rasa1 mutants in the DA and VV. Statistical analysis was carried out using one-way ANOVA with Sidak's correction. Data are mean±s.d. Scale bars: 20 µm. |
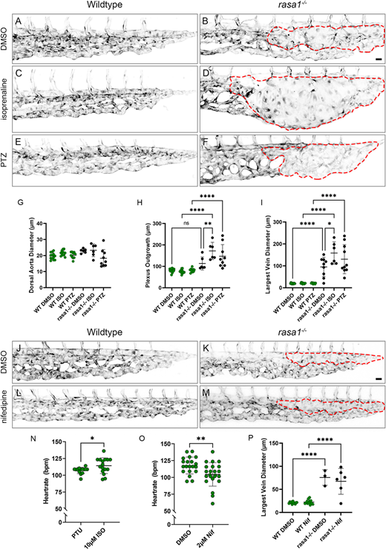
Modulation of flow does not rescue rasa1−/− malformations. (A-F) Confocal images of wild type and rasa1−/− on Tg(kdrl:EGFP) (black) when treated with DMSO, isoprenaline (iso) and phenylhydrazine (PTZ). Vascular malformations are outlined with a red dashed line. (G) Quantification of dorsal aorta diameter shows no significant difference between wild types and rasa1−/− with either drug [WTDMSO (n=13) versus rasa1−/−DMSO (n=9), P=0.19; WTiso versus rasa1−/−iso (n=6), P=0.88; WTPTZ versus rasa1−/−PTZ (n=10), P=0.74; N=3 experiments]. (H) Plexus outgrowth in wild type and rasa1−/− is significantly larger than wild types (WTDMSO versus rasa1−/−DMSO, P=0.21; WTiso versus rasa1−/−iso, P<0.0001; WTPTZ versus rasa1−/−PTZ, P<0.0001; N=3 experiments). Isoprenaline appears to increase plexus outgrowth when compared with untreated rasa1−/−DMSO (P=0.0086). (I) Increased largest vein diameter is not rescued in rasa1−/− upon either increasing or decreasing blood flow (WTDMSO versus rasa1−/−DMSO, P<0.0002; WTiso versus rasa1−/−iso, P<0.0001; WTPTZ versus rasa1−/−PTZ, P<0.0001, N=3 experiments). (J-M) Confocal images of wild type and rasa1−/− on Tg(kdrl:EGFP) (black) when treated with DMSO and nifedipine (nif). No treatments rescue rasa1−/− malformations. (N) Heart rate of wild-type embryos treated with isoprenaline increased by 6.6% [wild type, 177.1 bpm (n=14); WTiso, 114.2 bpm (n=16), P=0.0024; N=4 experiments]. (O) Heart rate of wild-type embryos treated with nifedipine decreased by 11.2% [WTDMSO, 117.7 bpm (n=20); WTnif, 104.5 bpm (n=23); P=0.0074; N=4 experiments]. (P) Quantification of largest vein diameter in wild types and rasa1−/− treated with DMSO and nifedipine [WTDMSO (n=12) versus rasa1−/−DMSO (n=3); P<0.0001; WTnif (n=13) versus rasa1−/−nif (n=6); P<0.0001, N=4 experiments]. Statistical analysis was carried out using one-way ANOVA with Sidak's correction for drug experiments. An unpaired t-test was used for heart rate analysis. Data are mean±s.d. Scale bars: 20 µm. |
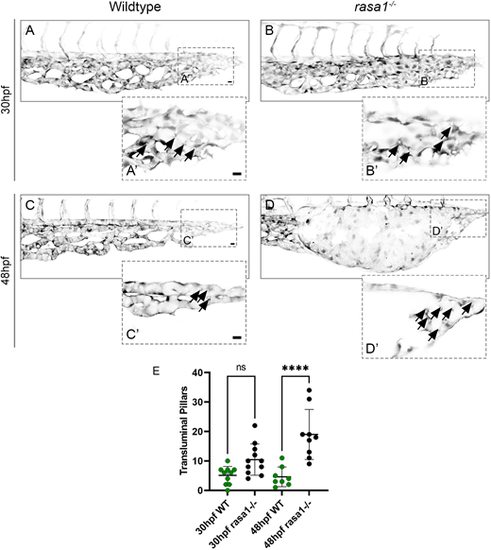
Increased intraluminal pillar number in rasa1−/− indicates incomplete intussusceptive angiogenesis. (A-D′) Confocal images of the caudal venous plexus of wildtype (A,C) and rasa1−/− mutants (B,D) on Tg(kdrl:EGFP) (black) at 30 hpf and 48 hpf. (A′,B′,C′,D′) Stacks of two to four slices illustrate regions of the plexus in more detail, with arrows indicating intraluminal pillars. (E) Quantification of pillars in the posterior 200 µm of the caudal venous plexus at 30 hpf shows no difference between wild types and rasa1−/− mutants [wild type (n=10) versus rasa1a−/− (n=11), P=0.09; N=3 experiments]; however, rasa1−/− mutants have significantly more pillars than wild types at 48 hpf [wild type (n=8) versus rasa1a−/− (n=9), P<0.0001; N=3 experiments]. Statistical analysis was carried out using one-way ANOVA with Sidak's correction. Data are mean±s.d. Scale bars: 10 µm. |

Proliferation and cell death do not drive AVM formation in rasa1 mutants. (A-D) Antibody staining of proliferative endothelial cells [arrows; phospho-histone H3 (PHH3)]. (E-H) Antibody staining of apoptotic endothelial cells [arrows; cleaved caspase 3 (cc3)]. No cc3 was observed in endothelium at 48 hpf. (I) PHH3 staining does not differ at 30 hpf or 48 hpf when compared with controls (30 hpf: wild type, 1.6 cells, n=18; rasa1−/−, 1.3 cells, P=0.98, n=18; N=2 experiments; 48 hpf: wild type, 1.4 cells, n=13; rasa1−/−, 1.3 cells, P>0.99, n=16; N=2 experiments). (J) There are no differences between wild types and mutants in cc3 staining (30 hpf: wild type, 0.6±0.7 cells, n=19; rasa1−/−, 0.5 cells, P>0.99, n=17; N=2 experiments; 48 hpf: wild type, 0 cells, n=22; rasa1−/−, 0 cells, P>0.99, n=17; N=2 experiments). (K) Endothelial cell counts reveal no significant difference in cell number between wild types and mutants at either timepoint (30 hpf: wild type, 159.2 cells, n=19; rasa1−/−, 161.9 cells, n=17, P=0.99; N=2 experiments; 48 hpf: wild type, 120.6 cells, n=22; rasa1−/−, 120.8 cells, n=17, P>0.99; N=2 experiments). Statistical analysis was carried out using one-way ANOVA with Sidak's correction. Data are mean±s.d. Scale bars: 20 µm. |
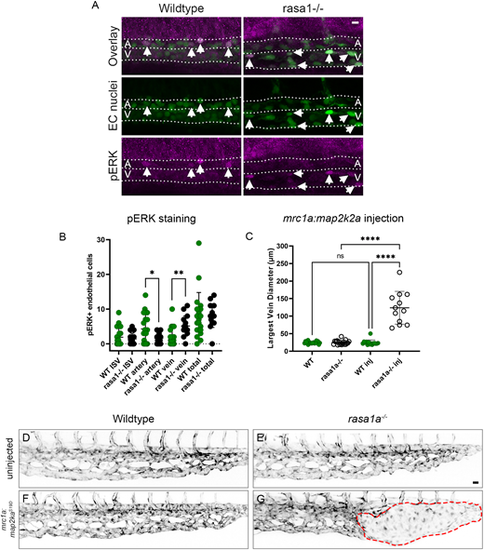
Ectopic venous activation of pERK in rasa1 mutants drives AVM development. (A) pERK antibody staining in wild type and mutants at 30 hpf. (B) rasa1 mutants show a significant increase in pERK in the vein (wild type, 2.0 cells, rasa1−/−, 5.1 cells; P=0.0020) and a decrease in the DA (wild type, 4.3 cells; rasa1−/−, 1.6 cells; P=0.03) with no change in ISVs at 30 hpf [wild type (n=20), 1.9 cells; rasa1−/− (n=15), 1.4 cells; P=0.5; N=3 experiments, unpaired t-tests]. (C-G) Overexpression of constitutively active map2k2a under a venous promoter (mrc1a) in sensitized rasa1a−/− mutants drives AVM formation. (C) Quantification of largest vein diameter with the ectopic expression of activated mrc1a:map2k2aS219D at 48 hpf. (D,E) Confocal images of uninjected wild type and rasa1a−/− [WTuninj (n=20) versus rasa1a−/−uninj (n=19); P>0.99]. (F,G) Confocal images of wild-type embryos and rasa1a−/− injected with mrc1a:map2k2aS219D [WTinj (n=15) versus rasa1a−/−inj (n=12); P<0.0001; N=2 experiments]. Statistical analysis was carried out using one-way ANOVA with Sidak's correction. Data are mean±s.d. Scale bars: 10 µm in A; 20 µm in D-G. |

Pharmacological rescue of rasa1 mutants by MEK inhibition and venous cell size changes. (A-D) Confocal images of wild type and rasa1 mutants on Tg(kdrl:EGFP;gata1a:dsRed) [Tg(kdrl:EGFP) is in black] when treated with DMSO or the MEK inhibitor SL327. Vascular malformations are outlined with a dashed red line. (E-H) Confocal images of wild type and rasa1−/− on Tg(kdrl:EGFP) (black) when treated with DMSO and BEZ235. (I) Rescue of largest vein diameter is seen in rasa1 mutants treated with SL327 (WTDMSO versus rasa1−/−DMSO, P<0.0001; WTSL327 versus rasa1−/−SL327, P=0.64; N=1 experiment). (J) No rescue is seen by the treatment of mutants with BEZ235. Quantification of the largest vein diameter in wild type and rasa1−/− treated with DMSO and BEZ235 [WTDMSO (n=19) versus rasa1−/−DMSO (n=7); P<0.0001; WTDMSO versus rasa1−/−BEZ235 (n=9), P<0.0001; N=5 experiments]. (K) Quantification of cell size at 48 hpf using the VE-Cadherin (Cdh5) membrane marker (WTartery, n=34; WTvein, n=38; rasa1−/−artery, n=36; rasa1−/−vein, n=41), where rasa1−/− vein cells are significantly larger than wild-type vein cells (P<0.0001) and larger than rasa1−/− arterial cells (P<0.0001). (L) Quantification of cell size at 48 hpf using the fli:lifeact marker (WTartery, n=29; WTvein, n=50; rasa1−/−artery, n=23; rasa1−/−vein, n=36) at 40×magnification also showing that rasa1−/− vein cells are significantly larger than wild-type vein cells (P<0.0001) and larger than rasa1−/− arterial cells (P<0.0001). (M,N) Confocal images of fli:lifeact transgene marking endothelial cells with schematic traces of cell borders in the DA (indicated by the adjacent red bar) and in the CVP (indicated by the adjacent blue bar) to show relative cell size in arteries and veins in wild types (M) and rasa1 mutants (N). Statistical analysis was carried out using one-way ANOVA with Sidak's correction. Data are mean±s.d. Scale bars: 20 µm. |