
- Title
-
In Silico Analysis, Anticonvulsant Activity, and Toxicity Evaluation of Schisandrin B in Zebrafish Larvae and Mice
- Authors
- Nieoczym, D., Banono, N.S., Stępnik, K., Kaczor, A.A., Szybkowski, P., Esguerra, C.V., Kukula-Koch, W., Gawel, K.
- Source
- Full text @ Int. J. Mol. Sci.
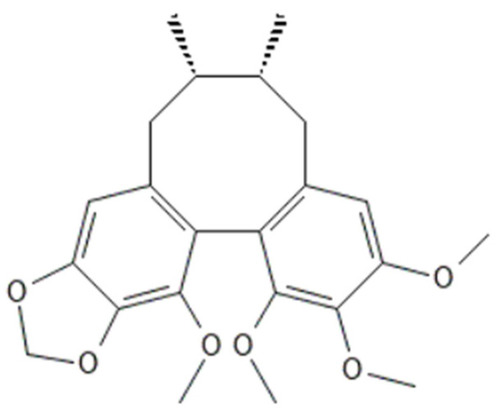
The chemical structure of schisandrin B. |
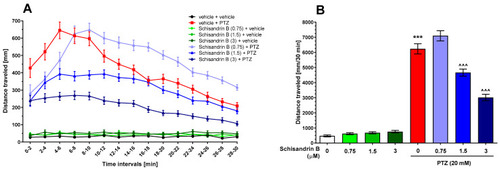
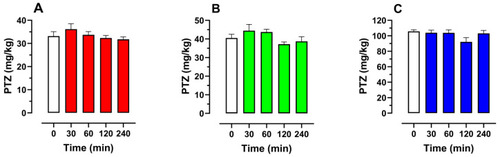
The effect of schisandrin B (0.75–3 µM) on PTZ-induced seizure-like activity in zebrafish larvae. The data are expressed as distance traveled (in mm) by larvae in 2 min-long time bins ( |
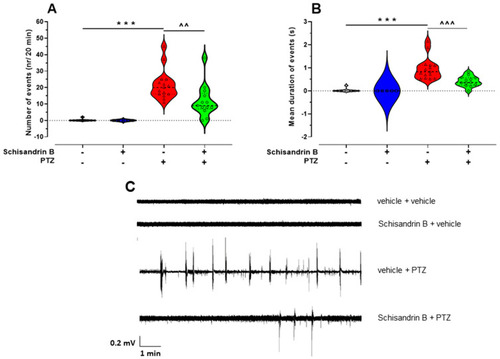
The effect of schisandrin B on epileptiform-like activity in the optic tectum of larval zebrafish treated with PTZ. Six-day-old fish were incubated with schisandrin B (3 µM) for 24 h and subsequently exposed to PTZ (20 mM). After a 5 min delay, LFP recordings from the larval optic tectum were obtained. Data are shown as: number of events (nr/20 min) ( |
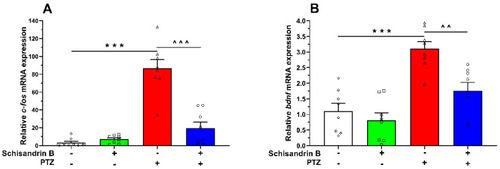
The effect of schisandrin B on |
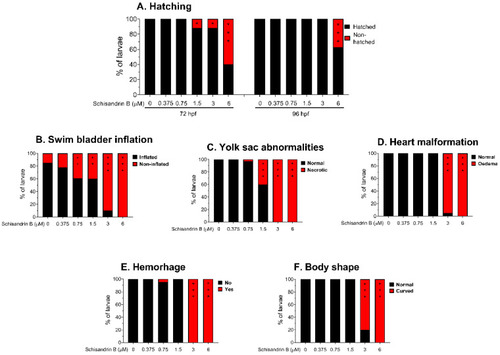
The effect of schisandrin B on hatching at 72 and 96 hpf ( |
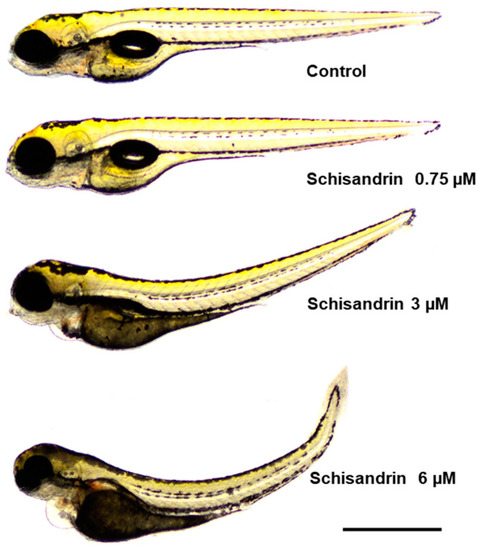
Representative images of the zebrafish larvae from the toxicity test. One hpf zebrafish embryo was exposed to different concentrations of schisandrin B (from 0.375 to 6 µM) for 95 h and, afterwards, pictures of the representative zebrafish larvae were taken. Larvae are shown to the same scale (bar = 1 mm). |
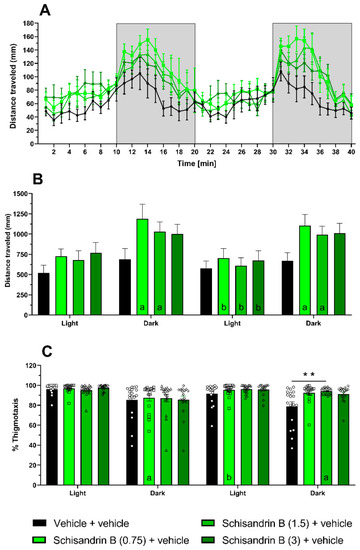
The effect of schisandrin B (3 µM) on zebrafish larval behavior in the light–dark and thigmotaxis tests. The data are shown as: distance traveled (in mm) by larvae when exposed to alternating light (100%) and dark (0%) conditions in 1 min-long time bins ( |
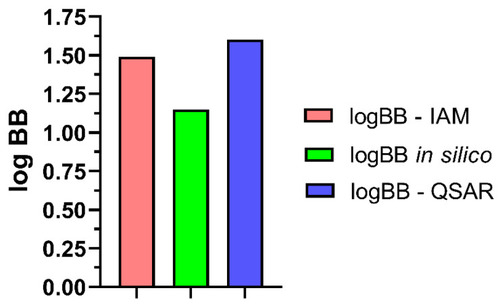
LogBB values calculated for schisandrin B. logBB in silico—the value calculated using ACD/Percepta software, logBB-QSAR—the value calculated based on Equation (1), and logBB-IAM—the value determined from the biomimetic IAM system. |
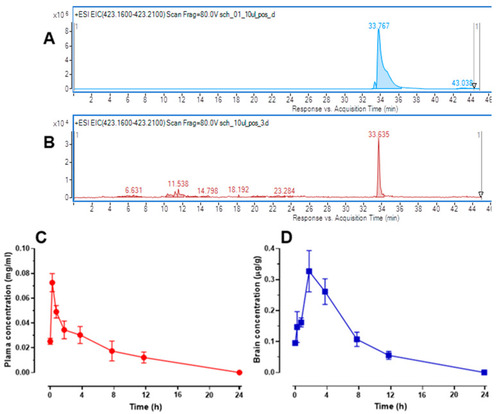
Mass chromatogram recorded in the positive ionization mode for the reference solution of schisandrin B (concentration 1 mg/mL, injection volume: 10 µL) ( |
The time–course effect of schisandrin B (50 mg/kg, |
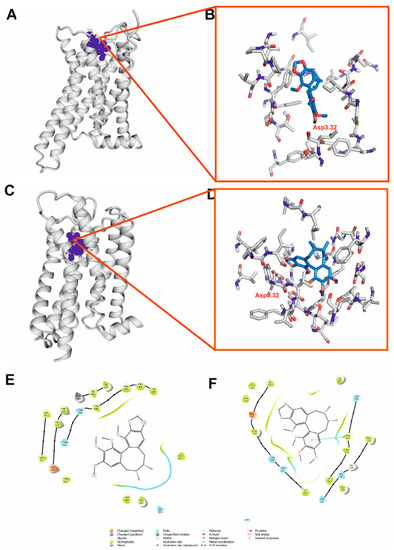
Molecular interactions of schisandrin B with D2 receptor ( |
Molecular interactions of schisandrin B with NMDA receptor based on molecular docking. ( |
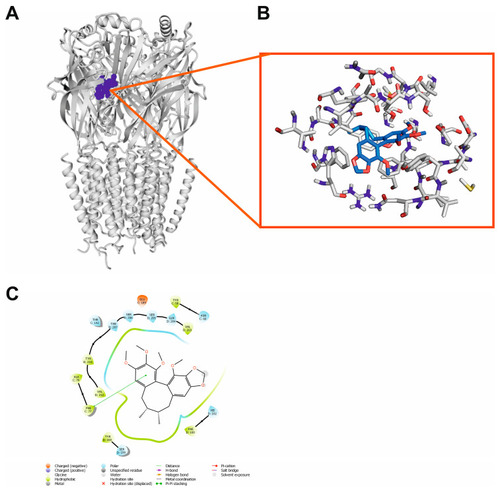
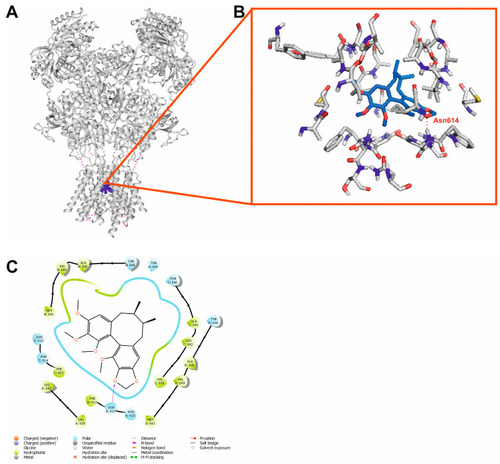
Molecular interactions of schisandrin B with GABAA receptor based on molecular docking. ( |