
- Title
-
Actin-mediated endocytosis in the E-YSL helps drive epiboly in zebrafish
- Authors
- Cheng, J.C., Miller, A.L., Webb, S.E.
- Source
- Full text @ Zygote
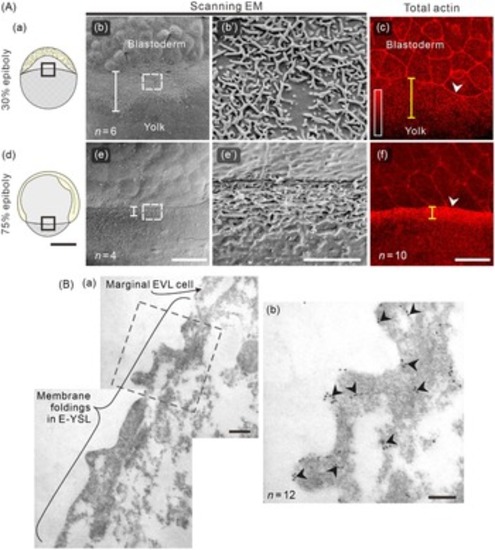
Morphology of the membrane surface protrusions and localization of actin in the E-YSL during epiboly. (Aa, Ad) Schematic illustrations of embryos at (Aa) 30% and (Ad) 75% epiboly. The regions bounded by the black squares show the regions imaged using scanning electron microscopy (SEM; in panels Ab, Ae) and confocal microscopy of rhodamine–actin fluorescence (in panels Ac, Af), at (Ab, Ac) 30% epiboly and (Ae, Af) 75% epiboly. The size of the region encompassing the membrane surface protrusions and punctate actin band are indicated by white and yellow measurement lines, respectively. In (Ab, Ae) the regions bounded by the white rectangles are shown at a higher magnification in (Ab′, Ae′). In (Ac, Af), the white arrowheads indicate the leading margins of the enveloping layer cells. (B) Visualization of actin in the E-YSL using immunogold labelling in conjunction with transmission electron microscopy (TEM). (Ba) The surface membrane protrusions in the E-YSL and part of a marginal EVL cell are shown. The region bounded by the black square is shown at a higher magnification in (Bb). In (Bb), the black arrowheads indicate the localization of actin clusters. Scale bars are 250 µm (Aa, Ad), 50 µm (Ab, Ac, Ae, Af), 10 µm (Ab′, Ae′), 1 µm (Ba), and 0.1 µm (Bb). |

The internalization of a 10-kDa FITC-labelled dextran in the absence or presence of cytochalasin B during epiboly. (A) Embryos were incubated with FITC-labelled dextran at (Aa) 30% or (Ab) 75% epiboly for 30 min and imaged at the blastoderm margin (n = 5 for each). (Ac) Histogram showing the size distribution of the internalized vesicles. (B) Embryos were injected with rhodamine-labelled actin at the single-cell stage and then bathed in FITC-labelled dextran at ∼75% epiboly. Images were acquired (Ba–Bc) immediately after or (Bd–Bf) 10 min after FITC–dextran removal, and show the localization of (Ba, Bd) total actin (Bb, Be) endocytosis and (Bc, Bf) the actin and endocytosis images when merged. (C) Effect of cytochalasin B on the localization of actin and endocytosis during epiboly. Embryos were injected with rhodamine-labelled actin and bathed in FITC-labelled dextran, as described in (B). At 50% epiboly some embryos were incubated with (Ca–Cc) DMSO (control) whereas others (Cd–Cf) were incubated with 5 µg/ml cytochalasin B. Images were acquired at ∼8 hpf, when the control embryos reached ∼75% epiboly. In (A–C), the dashed white lines indicate (when possible) the leading margin of the enveloping layer cells. In (B, C) the yellow and white measurement lines indicate the size of the region of highest red and green fluorescence, respectively, and the black measurement lines indicate the approximate region of overlap between the two. Scale bars, 50 µm. |

The effect of cytochalasin B and 5,5′-dibromo-BAPTA on the morphology of the membrane surface protrusions in the E-YSL at 75% epiboly. Scanning electron microscopy images showing the region of the E-YSL in (a) a representative DMSO-treated control embryo and in embryos incubated with (b, c) cytochalasin B at (b) 7.5 µg/ml or (c) 10 µg/ml, or (d) injected with 5,5′-dibromo-BAPTA to a final concentration of 5 mM. Scale bar is 10 µm. (e) Bar chart with mean ± SEM and individual data points to show the effect of cytochalasin B on the width of the short-axis dimension of the E-YSL membrane surface protrusions (examples indicated by the yellow measurement lines in panels a–c) when compared with the control. Asterisks indicate cytochalasin B data that are significantly different from the control at *P < 0.001 and **P < 0.0001, as determined by the Mann–Whitney U-test. |

Schematic to summarize our new findings and suggestions regarding the membrane surface protrusions, endocytosis and actin in the E-YSL during epiboly. The illustrations show embryos at (a–c) 30% epiboly and (d–f) 75% epiboly. The regions bounded by the black rectangles in (a) and (d) are shown at a higher magnification in (b) and (e), respectively, and the regions bounded by the pink squares in (b) and (e) are shown at a higher magnification in (c) and (f), respectively. AP, animal pole; VP, vegetal pole; DCs, deep cells; EVL, enveloping layer; E-YSL, external yolk syncytial layer; I-YSL, internal yolk syncytial layer; MTs, microtubules; MFs, microfilaments; YCM, yolk cell membrane; YCL, yolk cytoplasmic layer; YP, yolk platelets; YSN, yolk syncytial nuclei. Gilland et al. (1999) and Yuen et al. (2013) were the first to visualize Ca2+ waves traversing the blastoderm margin (including E-YSL), whereas the presence of a network of MTs in the E-YSL was first reported by Solnica-Krezel and Driever (1994). Scale bar, 250 µm (a, d); other images not drawn to scale. |